

Why you’re here
Engage is where the relationship is actively managed with the customer, and Digital Assessment is the diagnostic that anchors it. It’s scoped to a single project and pulls goals, challenges, workflows, tech stack, solutions, scoring, and team capability into one view you build with the customer — and with multiple customer teams directly. When you prep a QBR, you pull initiatives, outcomes, and progress from existing Bluplai data instead of starting from scratch, so QBR prep drops from ~6 hours to 2–3 hours. Partners who join the workspace see the same baseline you do — no re-doing discovery every time a new person lands. You work with the customer — not around them.Digital Assessment fills in from within each tab — open Goals & Challenges, Workflows, Tech Stack, Solutions, or the scoring tabs to add items. The assessment score updates as you fill it in.
What you’ll see
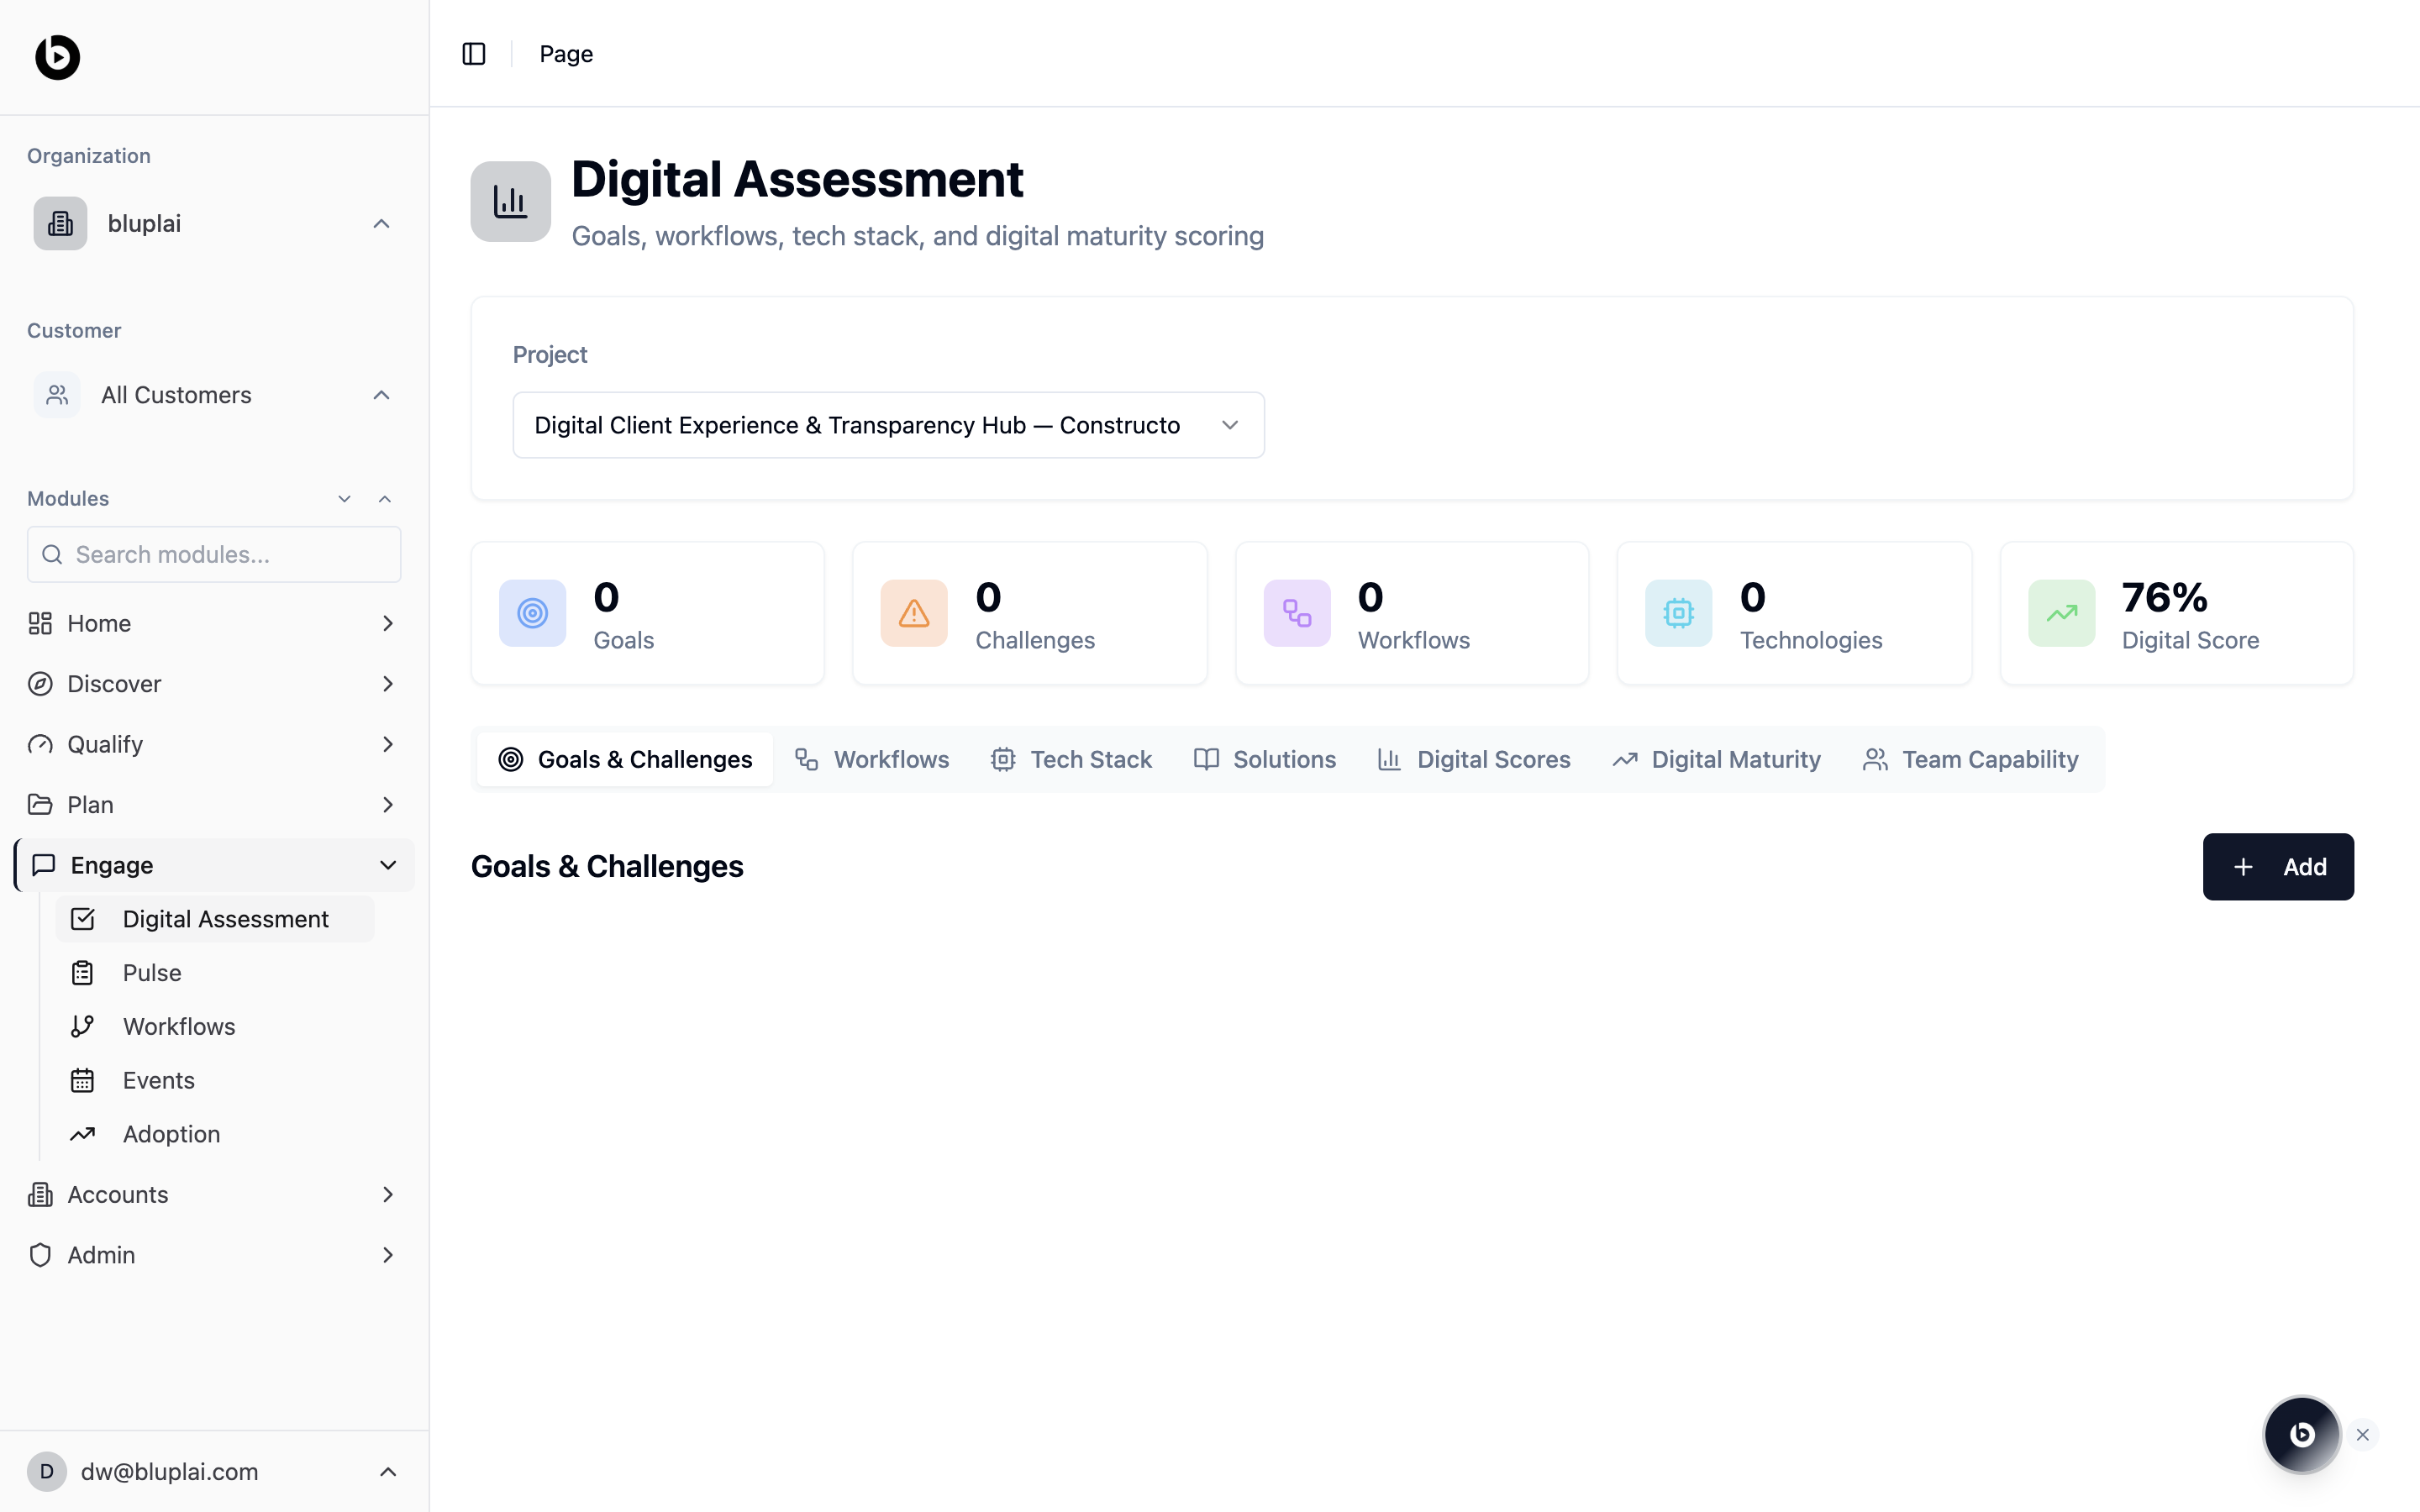
The page is driven by the Project selector at the top — every counter and tab swaps when you change projects. A header strip rolls up Goals, Challenges, Workflows, Technologies, and the overall Digital Score percentage (76% in the screenshot). Seven tabs sit below the strip, each covering a different lens on the project’s maturity.Tabs
Goals and Challenges
Workflows

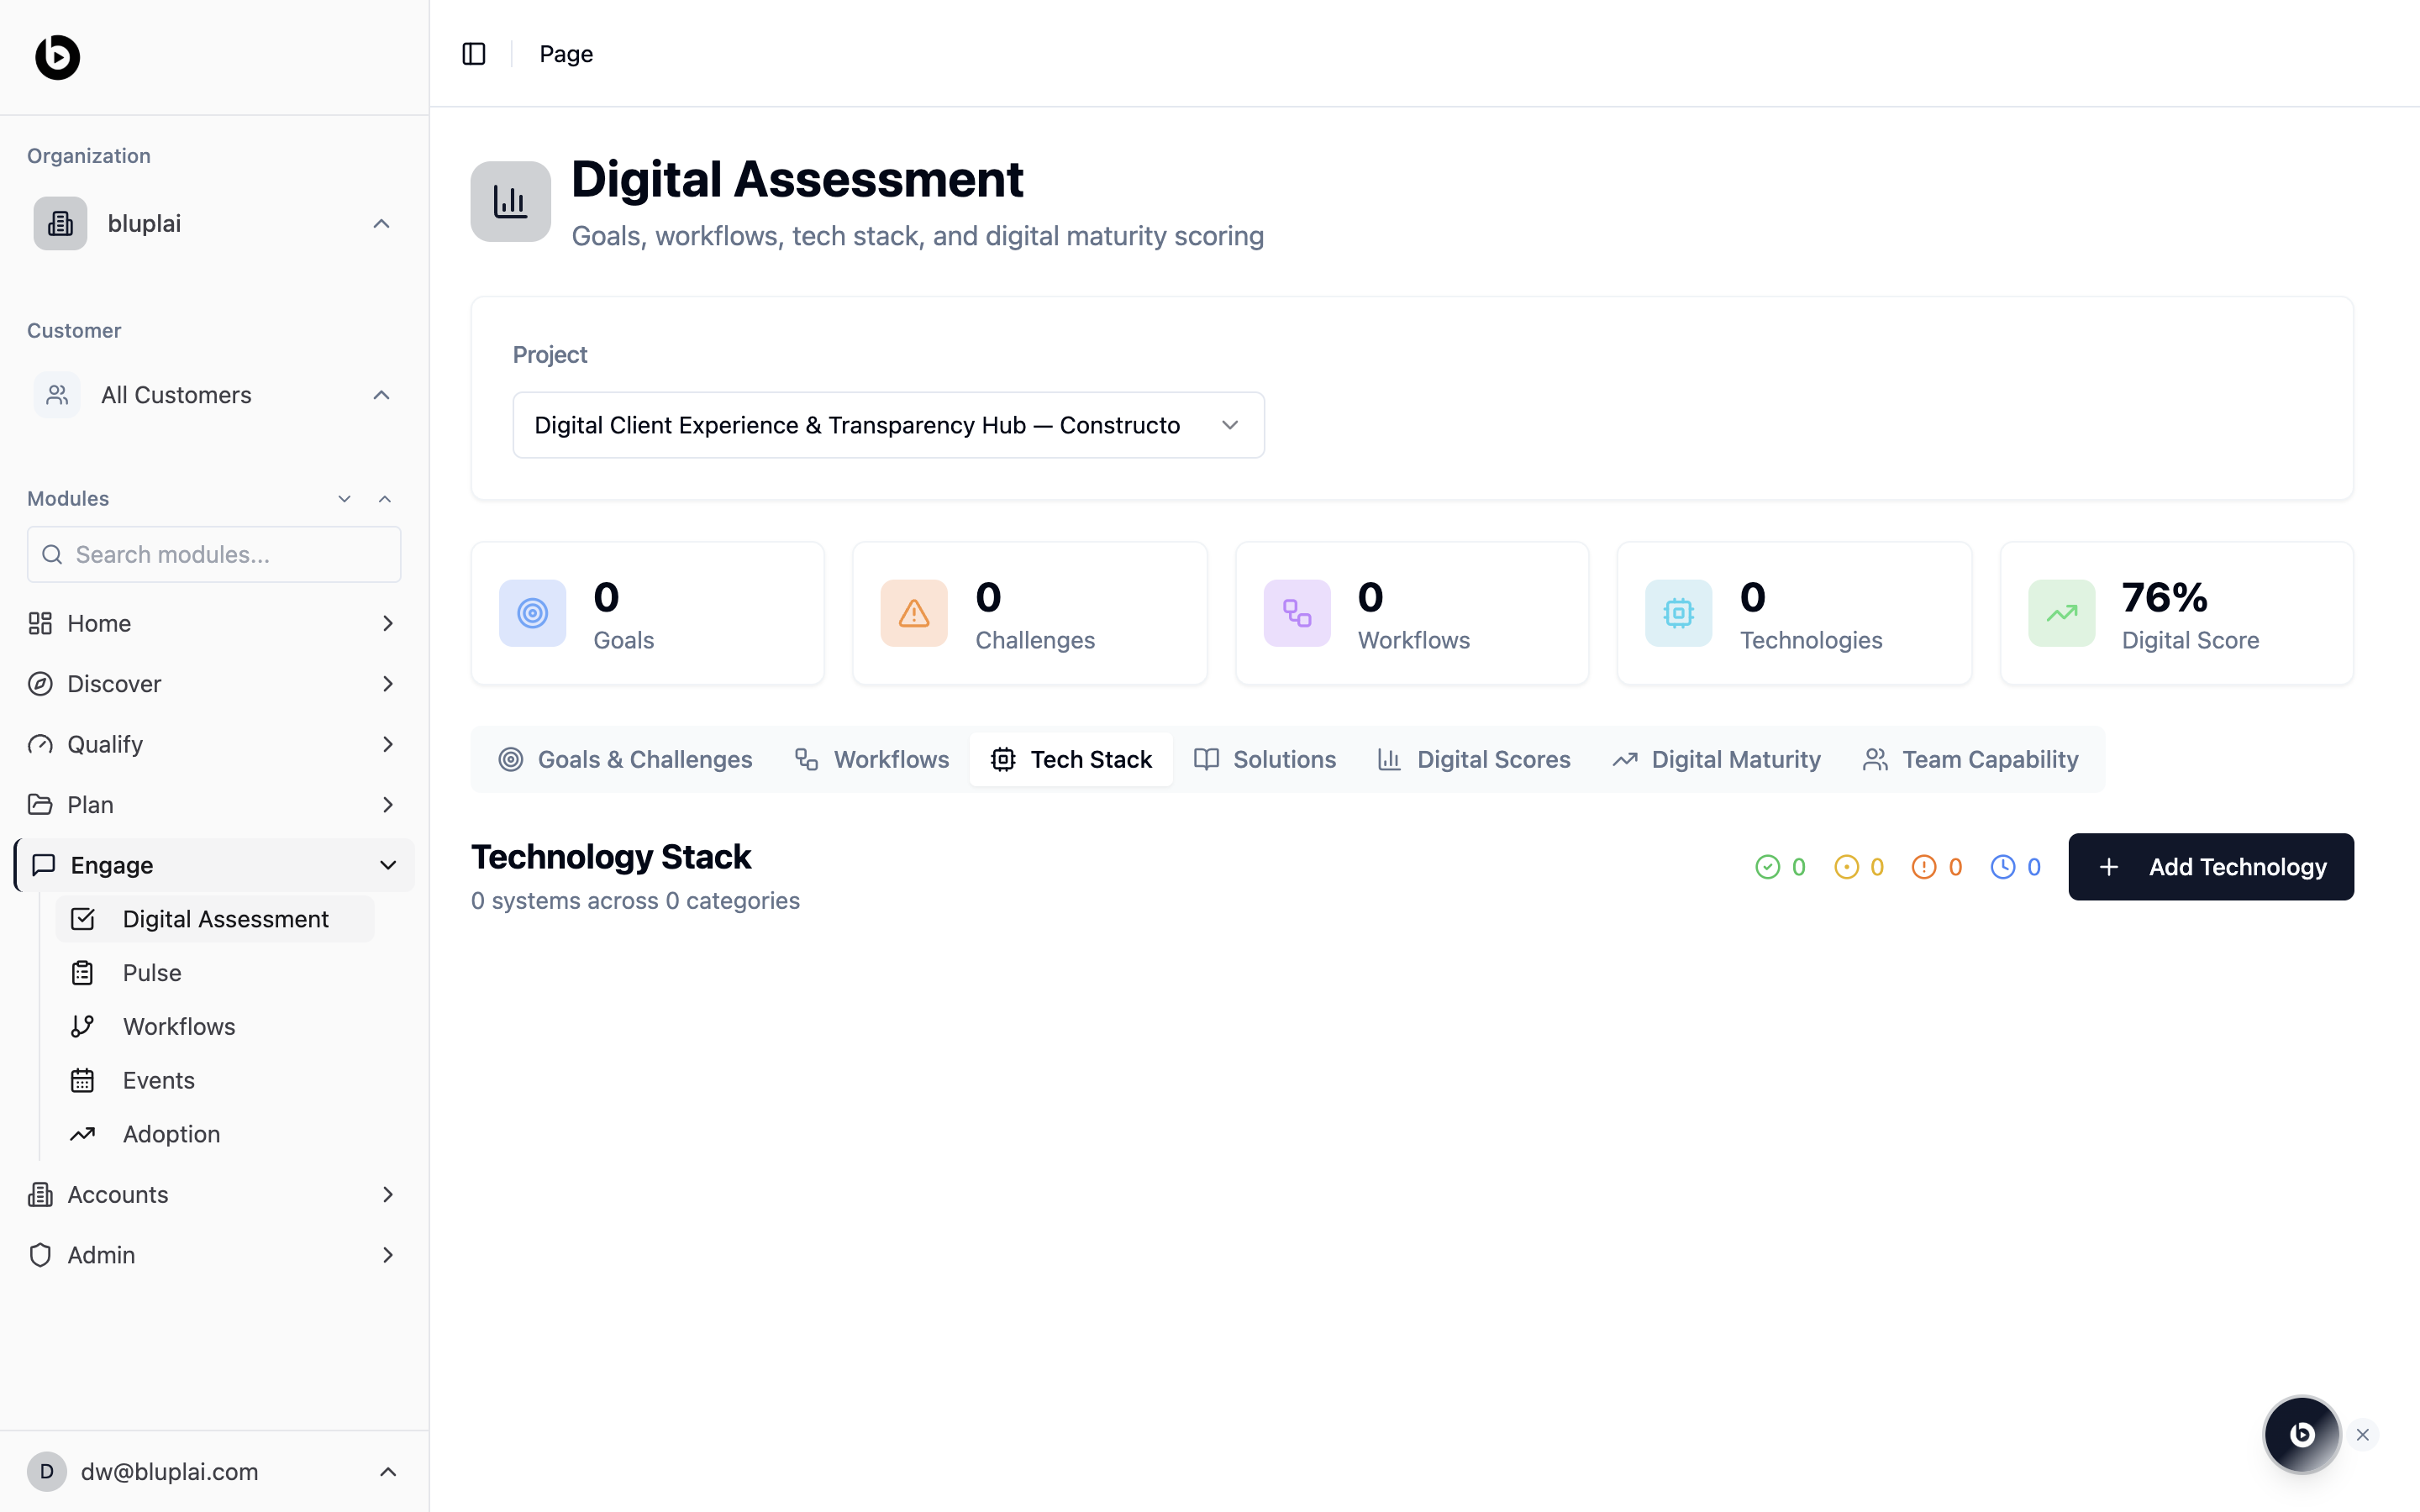
Tech Stack
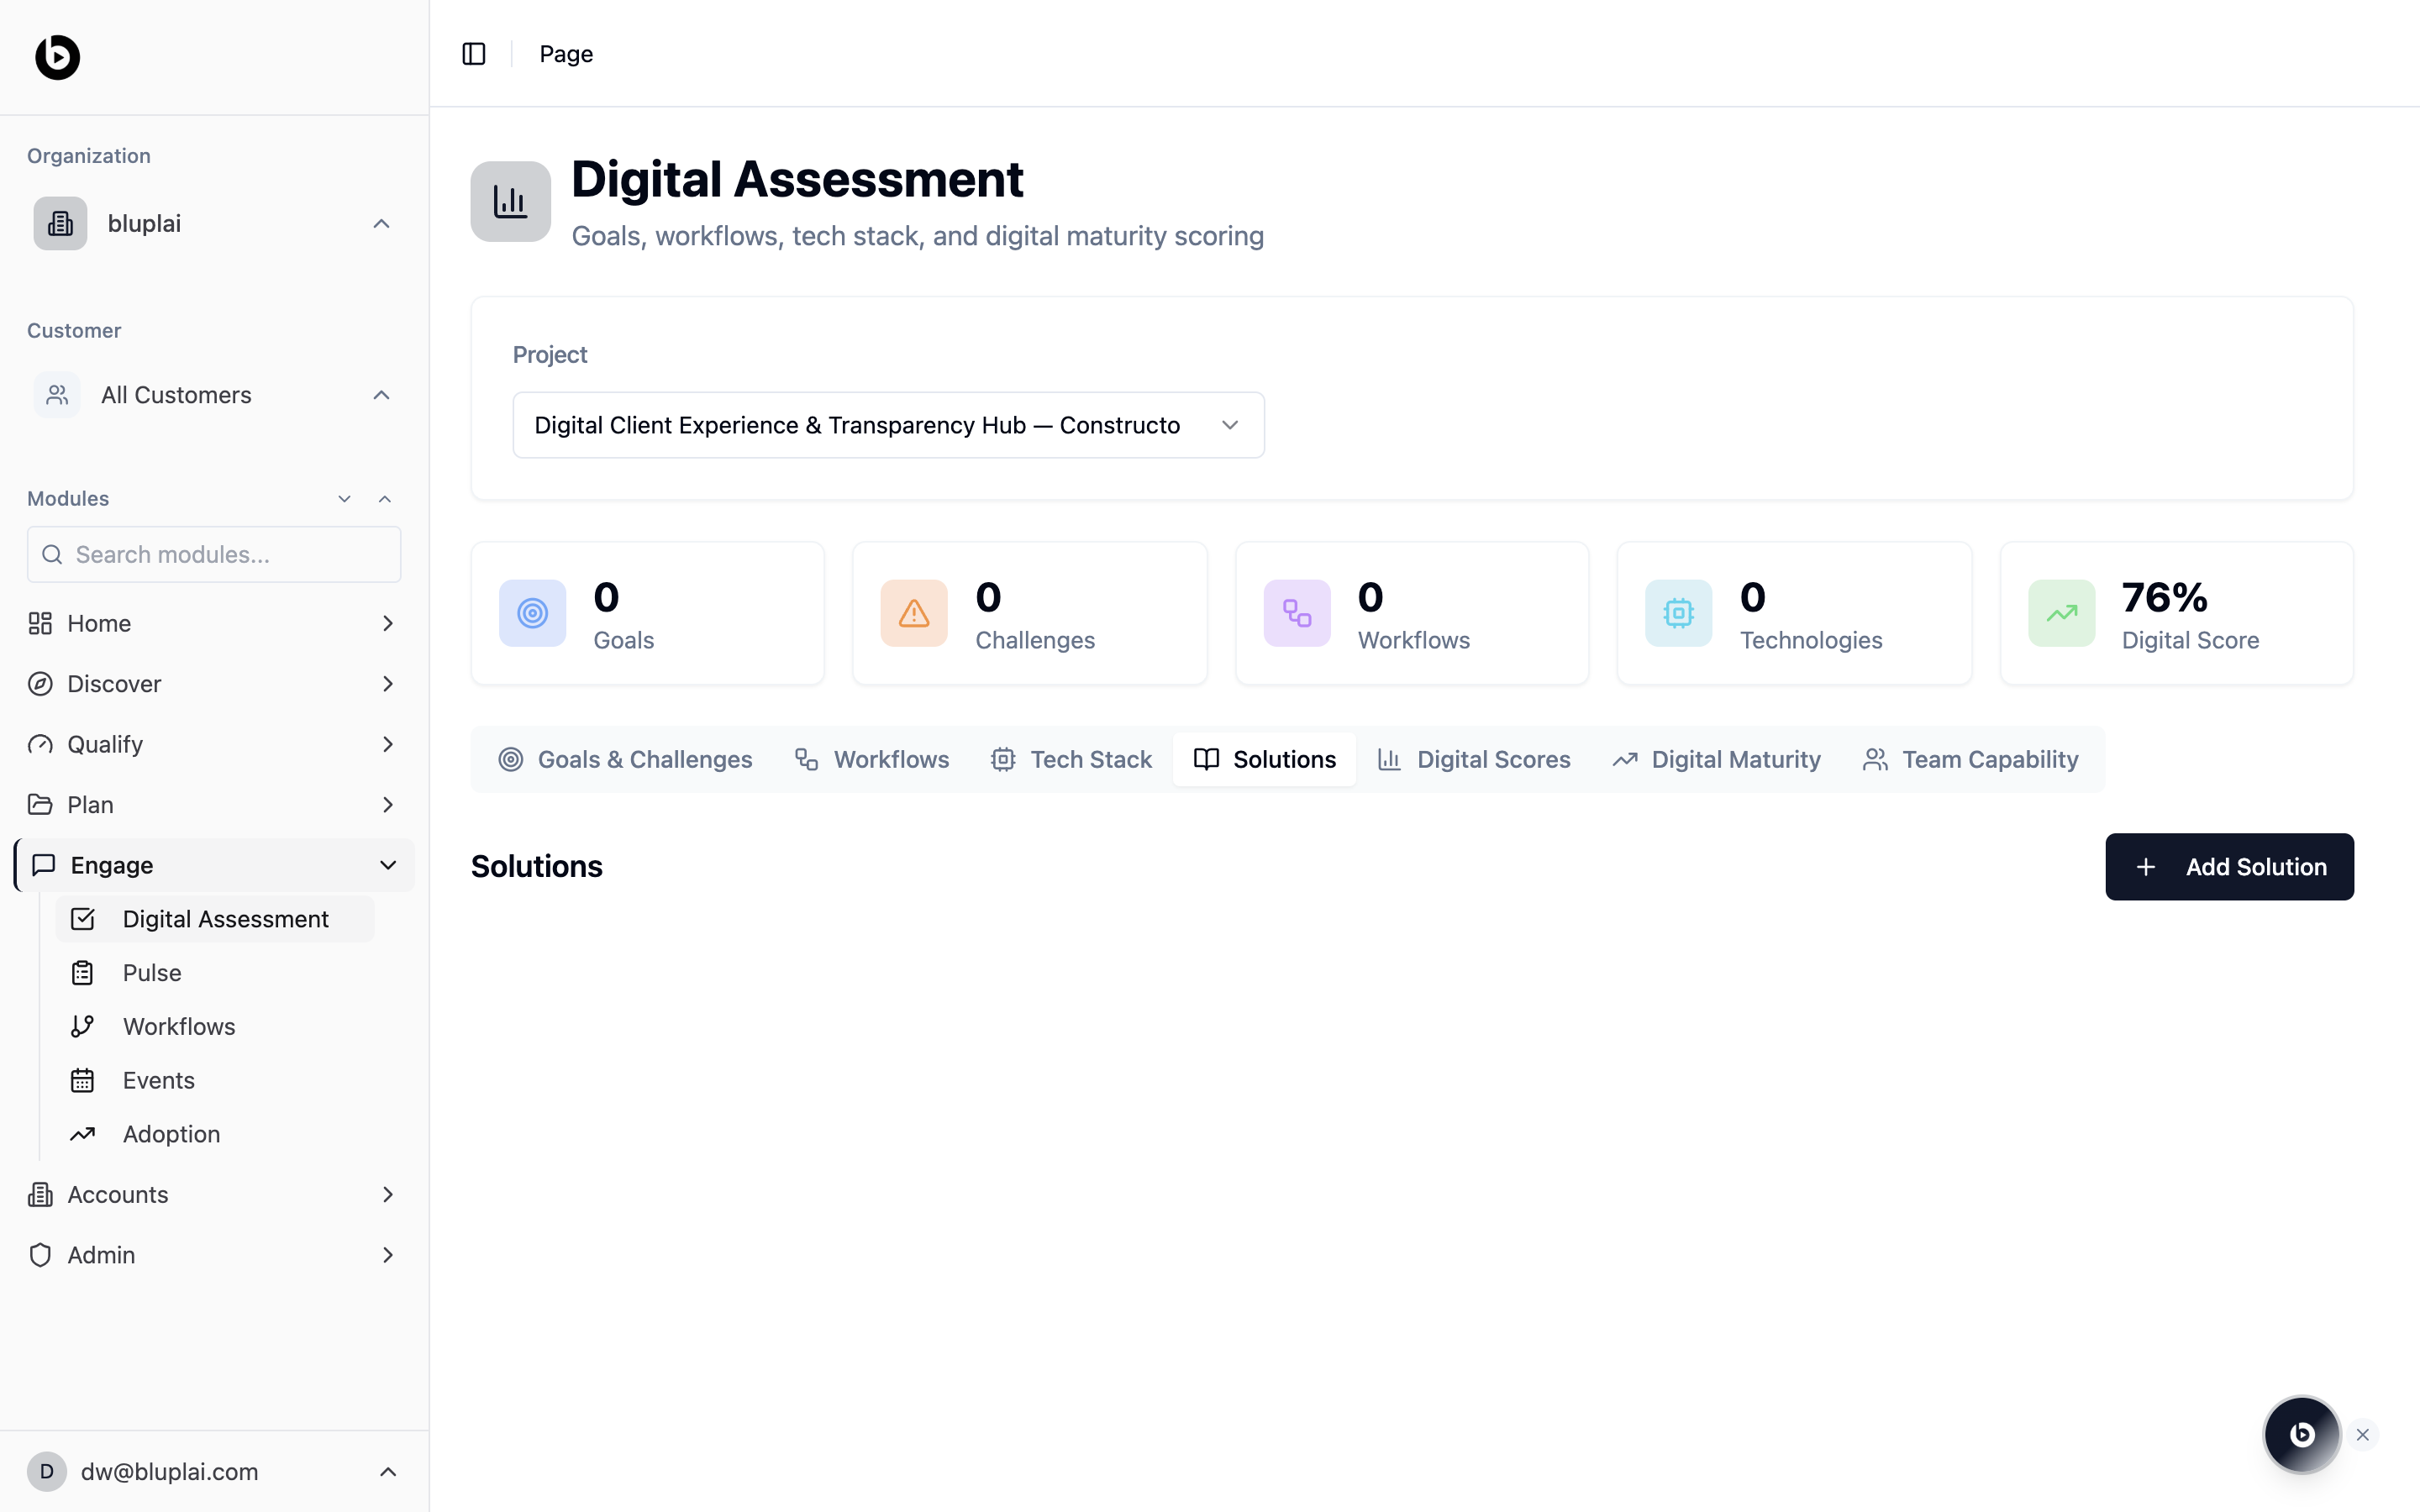
Solutions
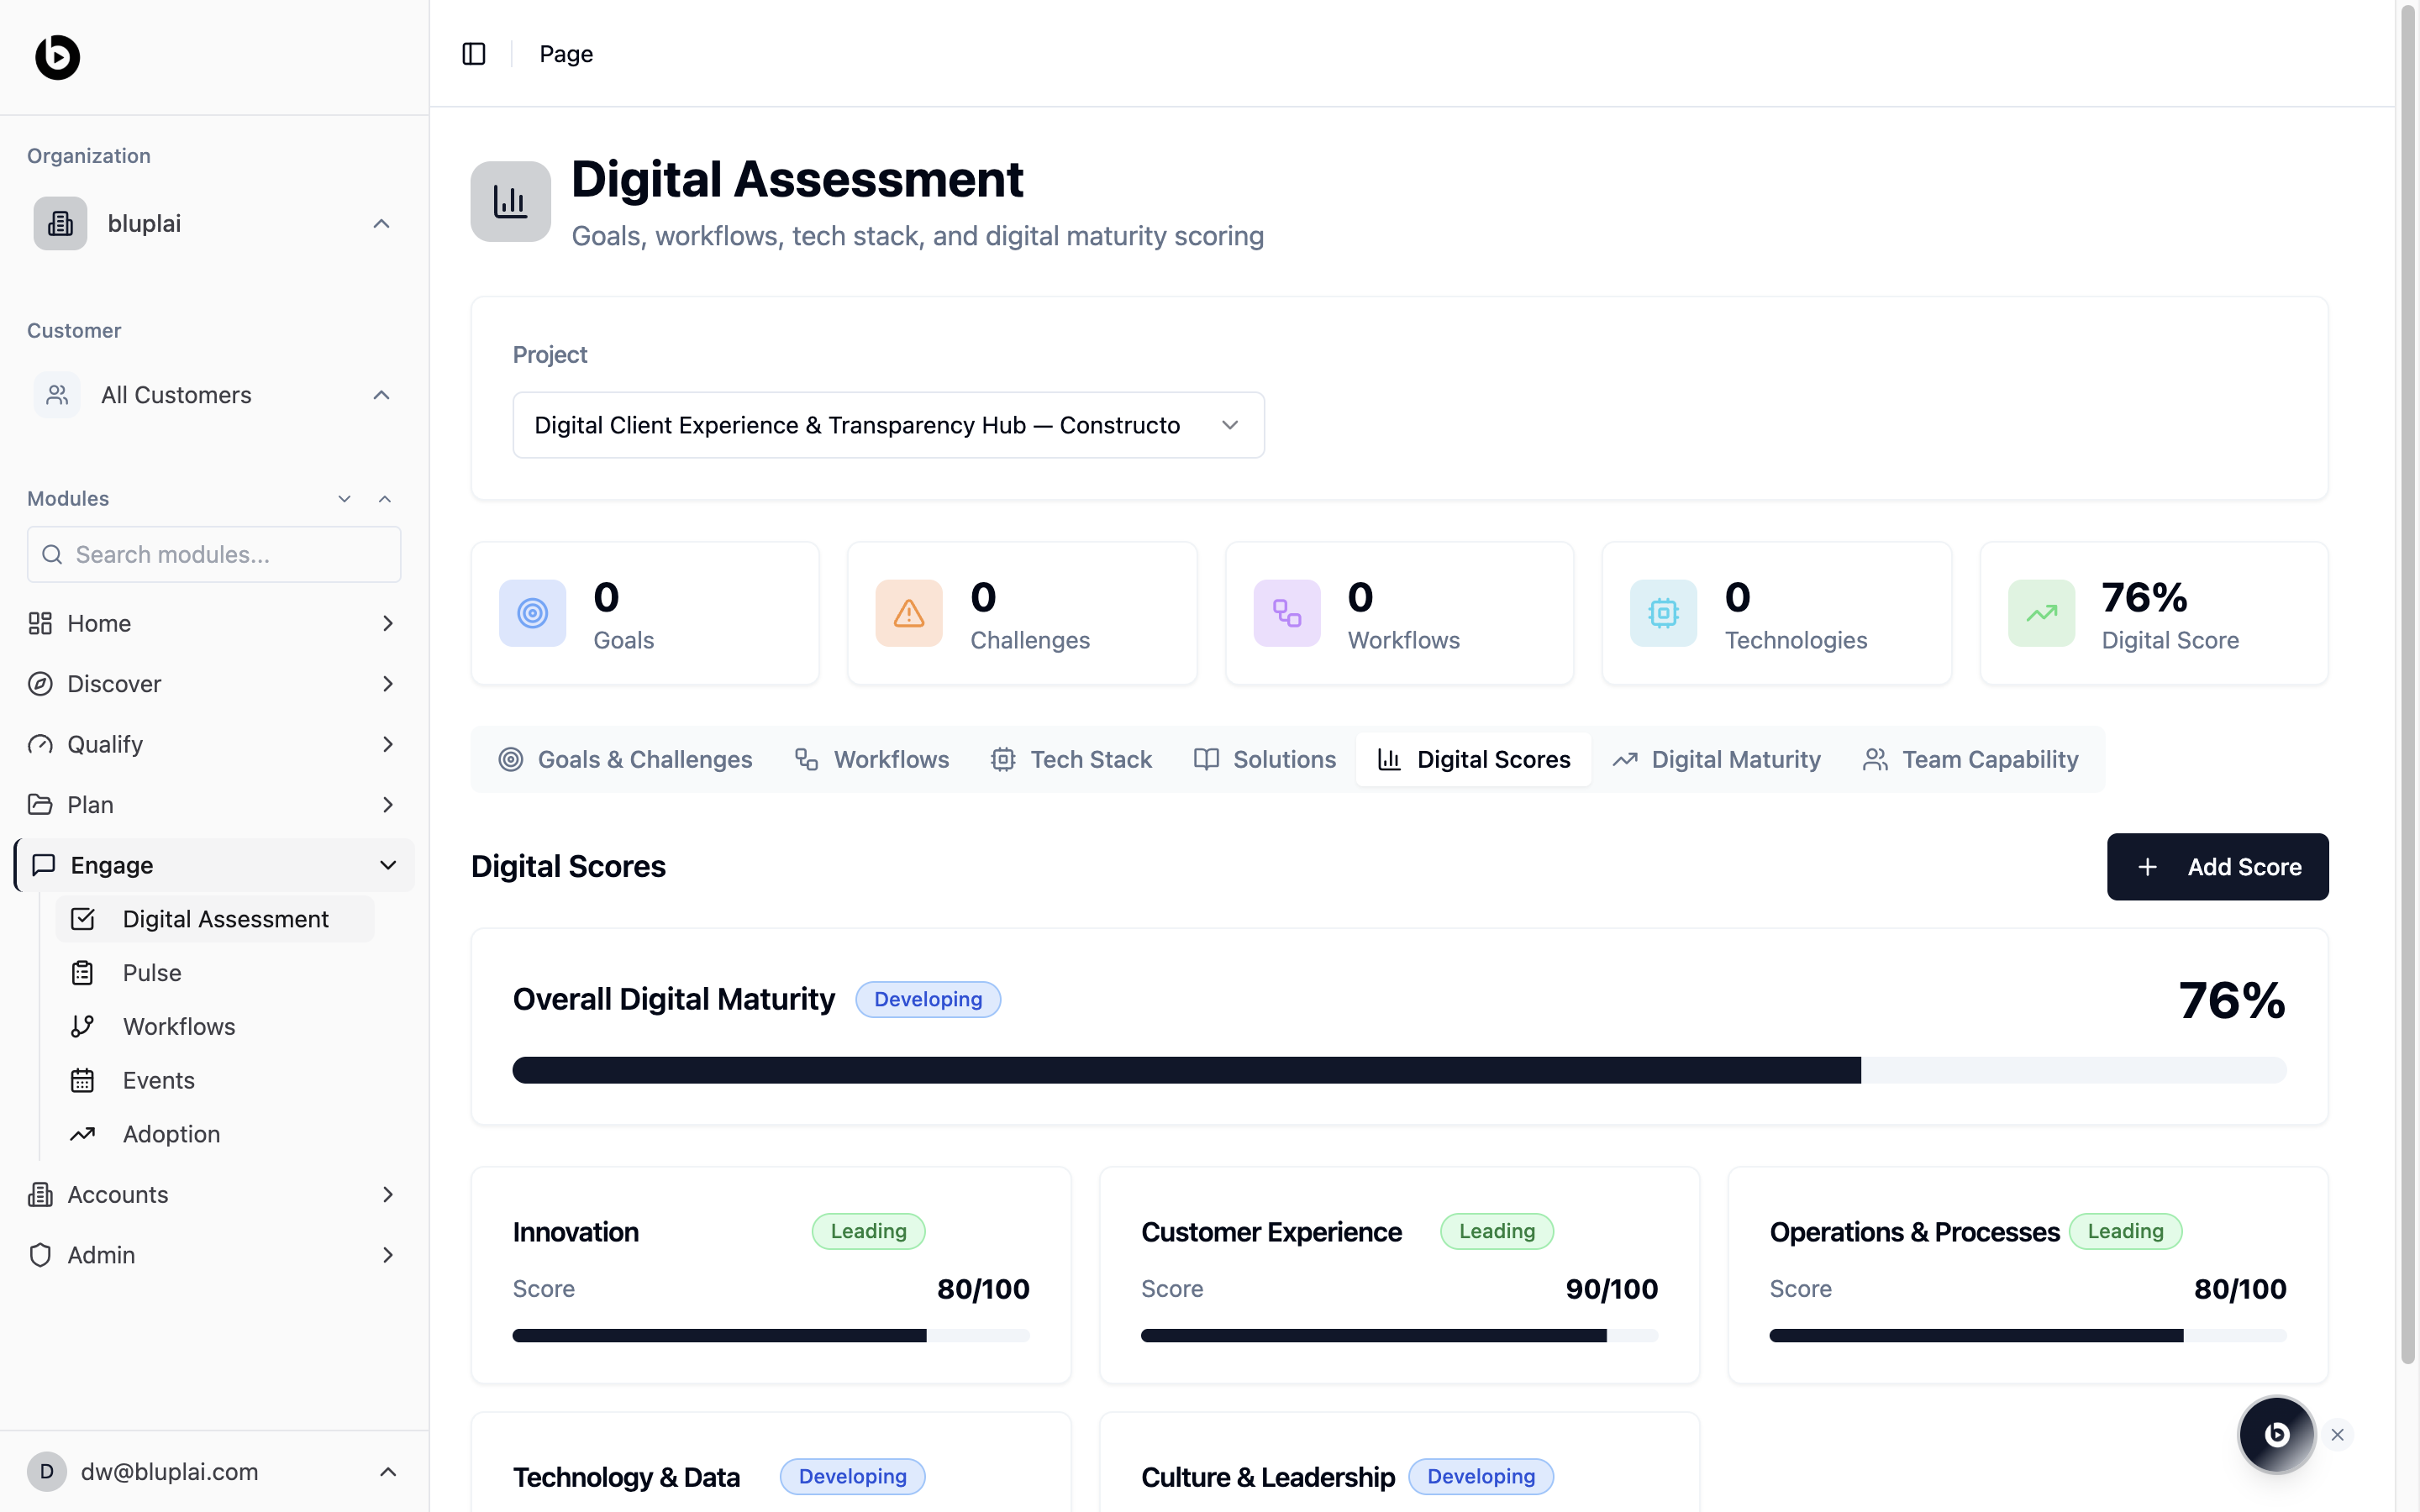
Digital Scores
Digital Maturity
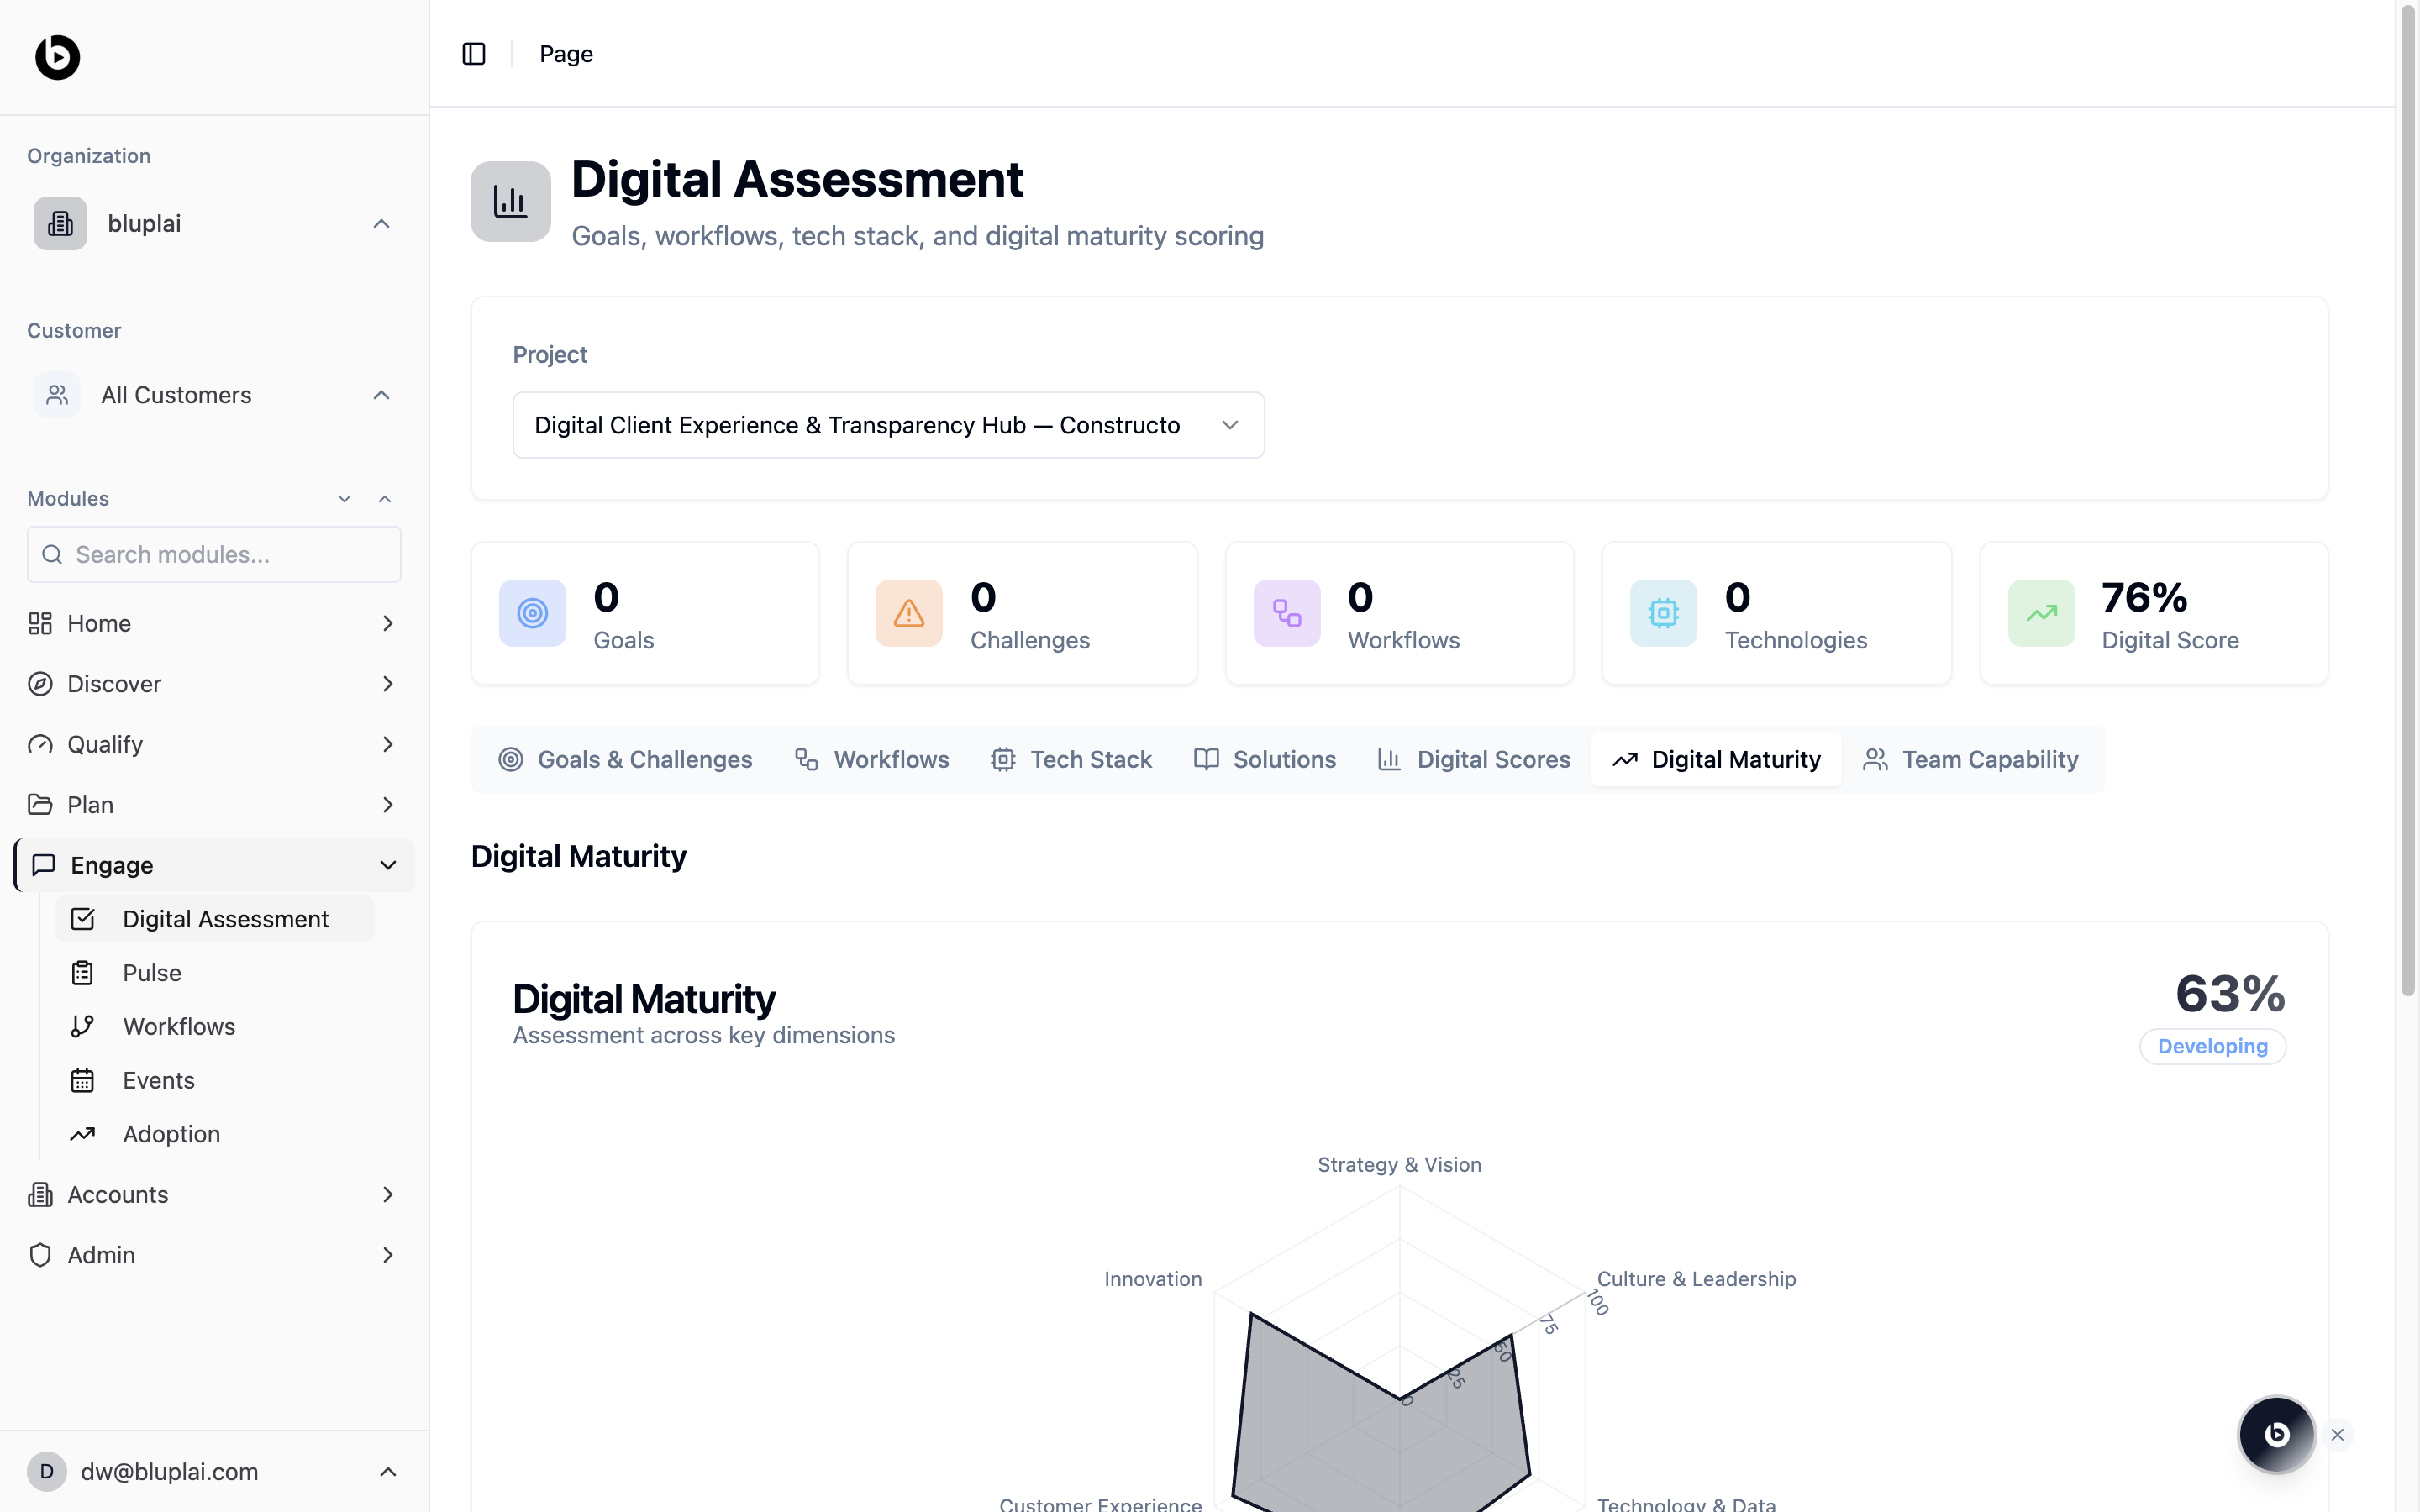
How it’s calculated
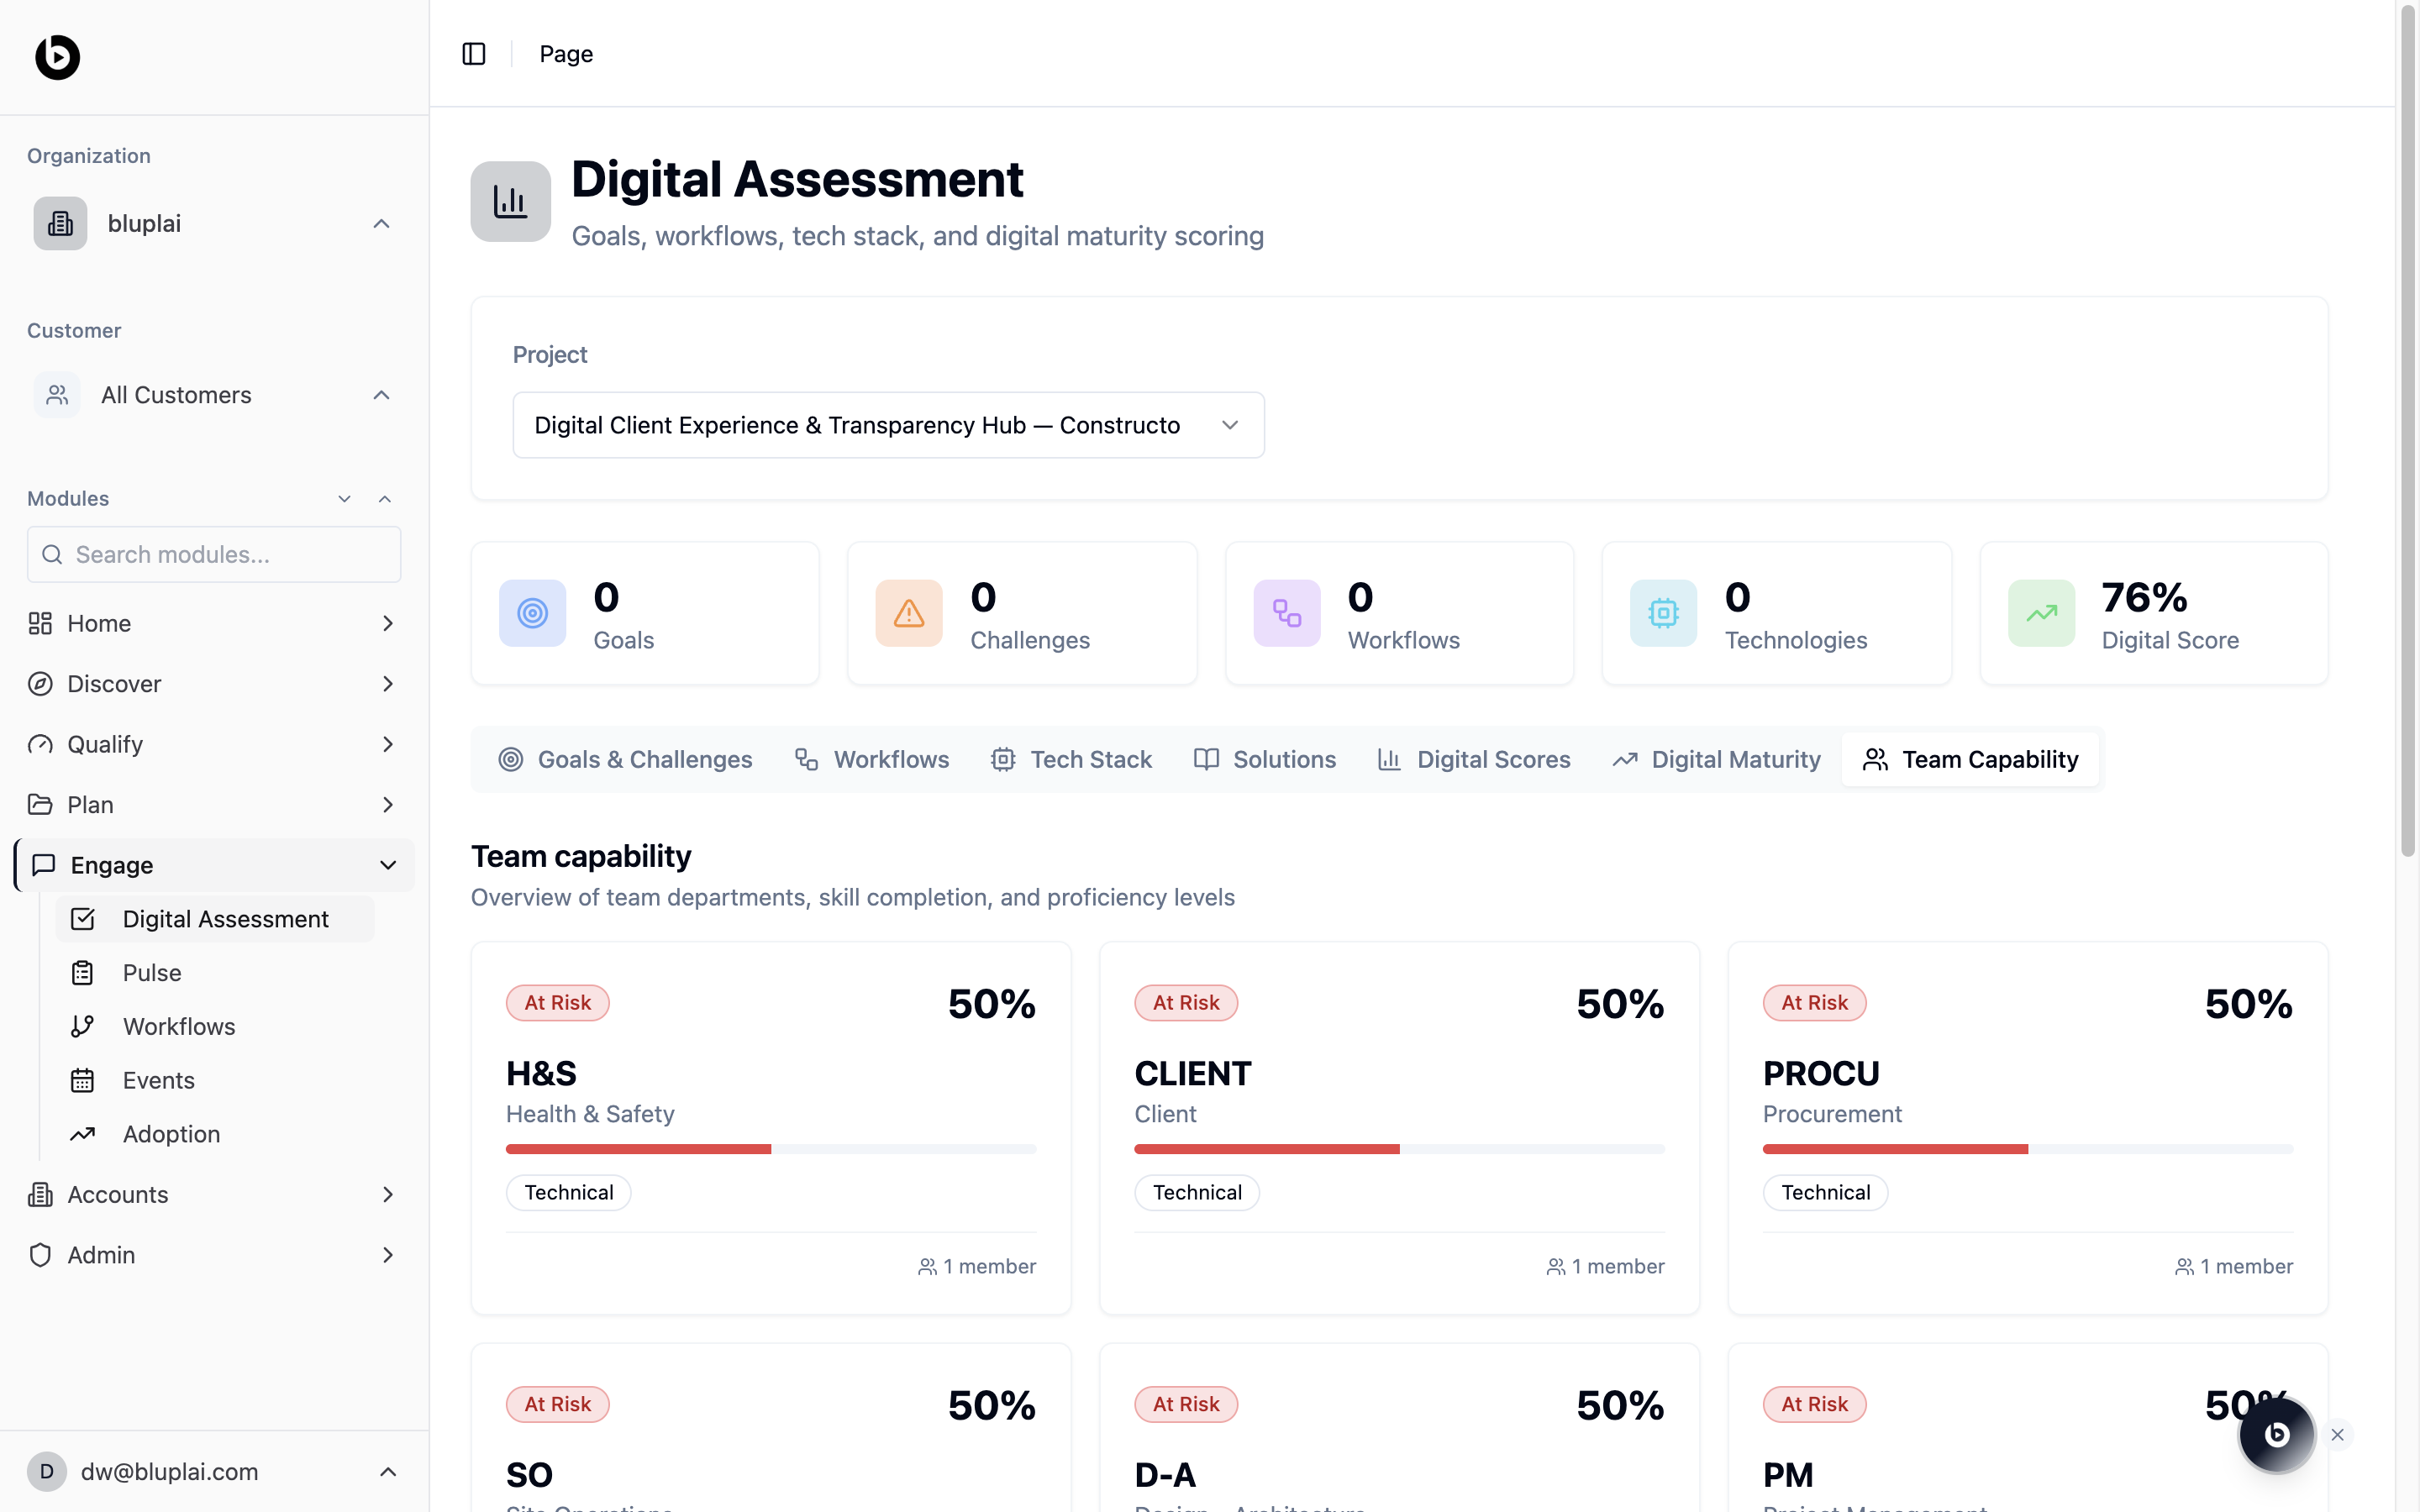
The radar is driven directly by the diagnostic scores you enter on this tab — there’s no separate aggregation step. Each slider supports either a 1–10 scale or a percentage toggle, and both feed the same axis on the radar. Assessment categories are editable per customer, so the axes reflect what matters for that specific engagement rather than a fixed template.Team Capability
When to use it
- Kicking off a new transformation project and capturing the baseline with the customer in the room
- Preparing for a discovery workshop where you need structured notes against each capability area
- Updating scores after a follow-up session so the Digital Score reflects the latest view
- Reviewing a project’s readiness before a steering committee or QBR
- Handing a partner the diagnostic without a 90-minute walkthrough call
Next
Workflows
Map the customer processes that feed into the assessment.
Pulse
Run interviews and surveys to validate what the assessment surfaces.