
Why you’re here
This is the customer’s org structure and team dynamics, rolled up into numbers you can act on. Helps you understand who owns what, where decisions really get made, and how the portfolio is trending. Open this when leadership wants a snapshot, or when you need to spot which accounts are drifting before the next review.What you’ll see
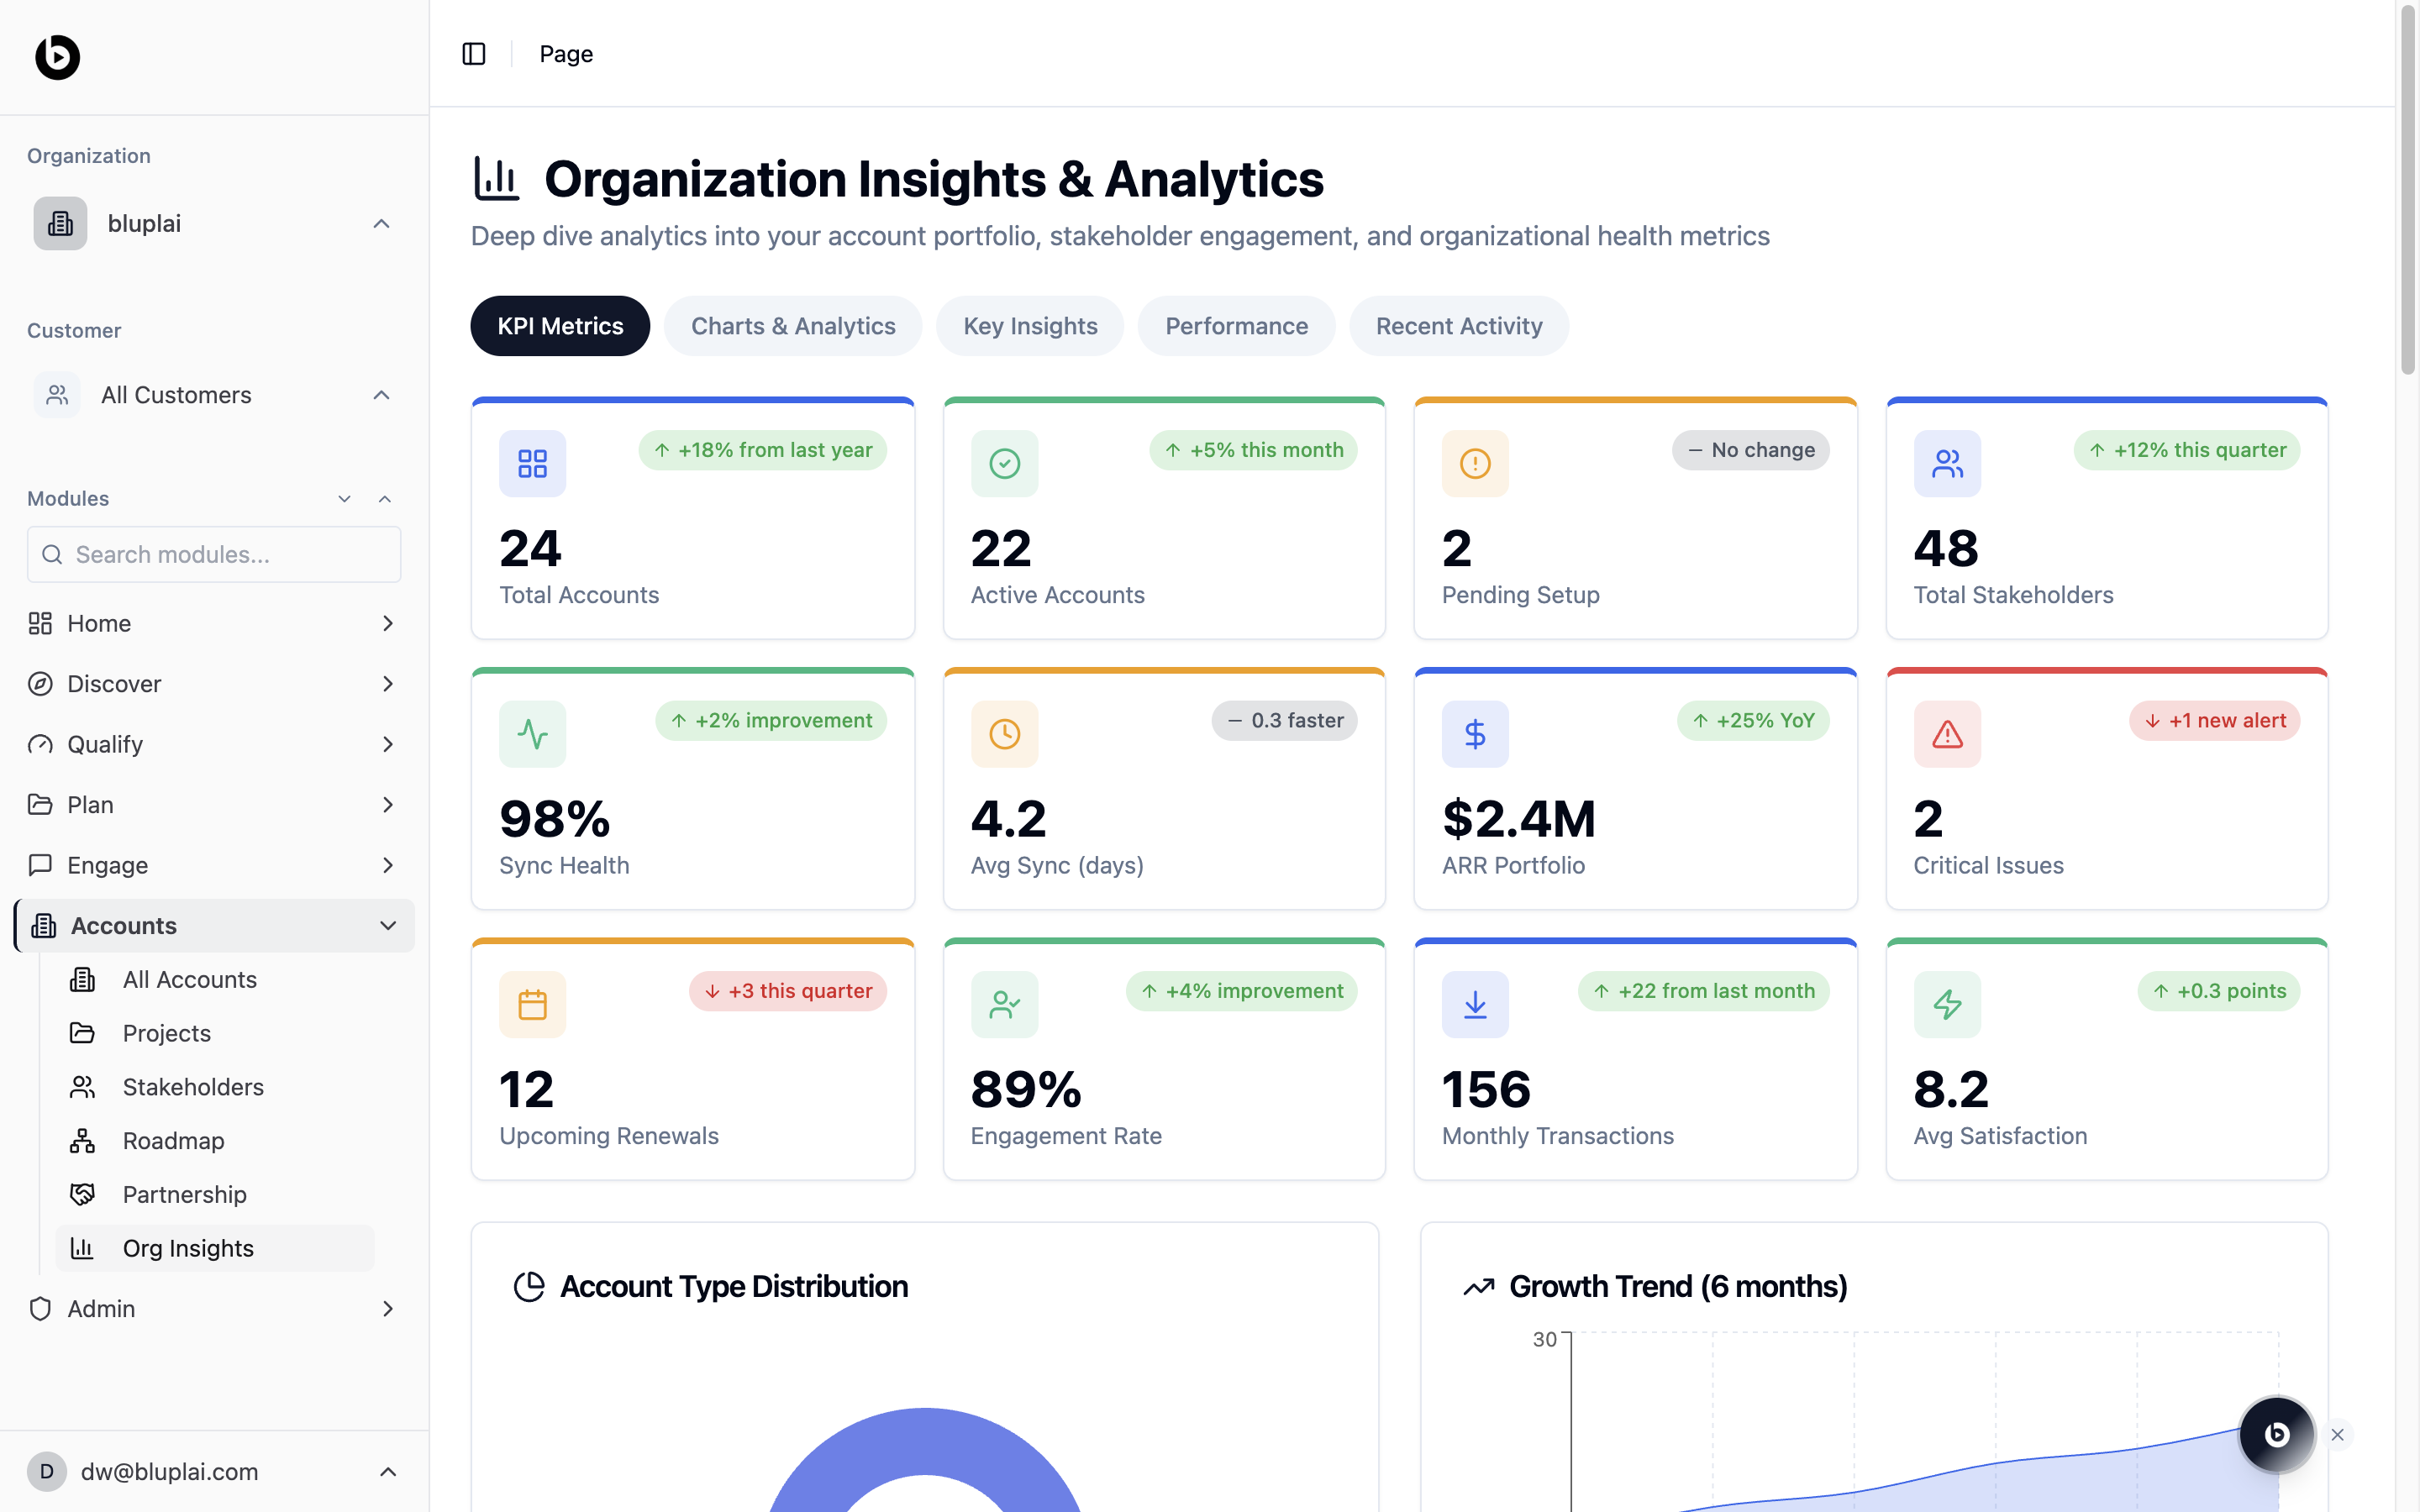
- A header titled Organization Insights & Analytics with the subtitle “Deep dive analytics into your account portfolio, stakeholder engagement, and organizational health metrics”.
- A tab row: KPI Metrics (selected), Charts & Analytics, Key Insights, Performance, and Recent Activity.
- A KPI grid with twelve tiles, each showing a current value and a period-over-period delta:
- Total Accounts, Active Accounts, Pending Setup, Total Stakeholders.
- Sync Health, Avg Sync (days), ARR Portfolio, Critical Issues.
- Upcoming Renewals, Engagement Rate, Monthly Transactions, Avg Satisfaction.
- Below the KPIs, charts for Account Type Distribution and a 6-month Growth Trend.
Org Insights rolls up data you add across Accounts, Stakeholders, and Projects — there’s nothing to create here directly.
When to use it
- Pull a quick portfolio snapshot before an exec update.
- Spot accounts drifting into risk — sync health dropping, critical issues rising.
- Compare engagement rate and satisfaction across the book.
- Track renewal pressure by looking at upcoming renewals alongside ARR portfolio.
Next
All accounts
Drill from the rollup into the individual customer portfolio.
Partnership
Check how specific engagements are tracking with their partner teams.