> ## Documentation Index
> Fetch the complete documentation index at: https://docs.bluplai.com/llms.txt
> Use this file to discover all available pages before exploring further.
# Value
> Model the ROI, benefits, and impacts of the deal in one place — instead of scattered spreadsheets and slideware.
 ## Why you're here
Value is where qualified drivers and outcomes turn into a business case. This tab replaces the usual spreadsheet-plus-slide workflow with a single model the whole team — and the customer — can read. Return on investment, benefits, impacts, and the assumptions behind them are all structured side by side.
## What you'll see
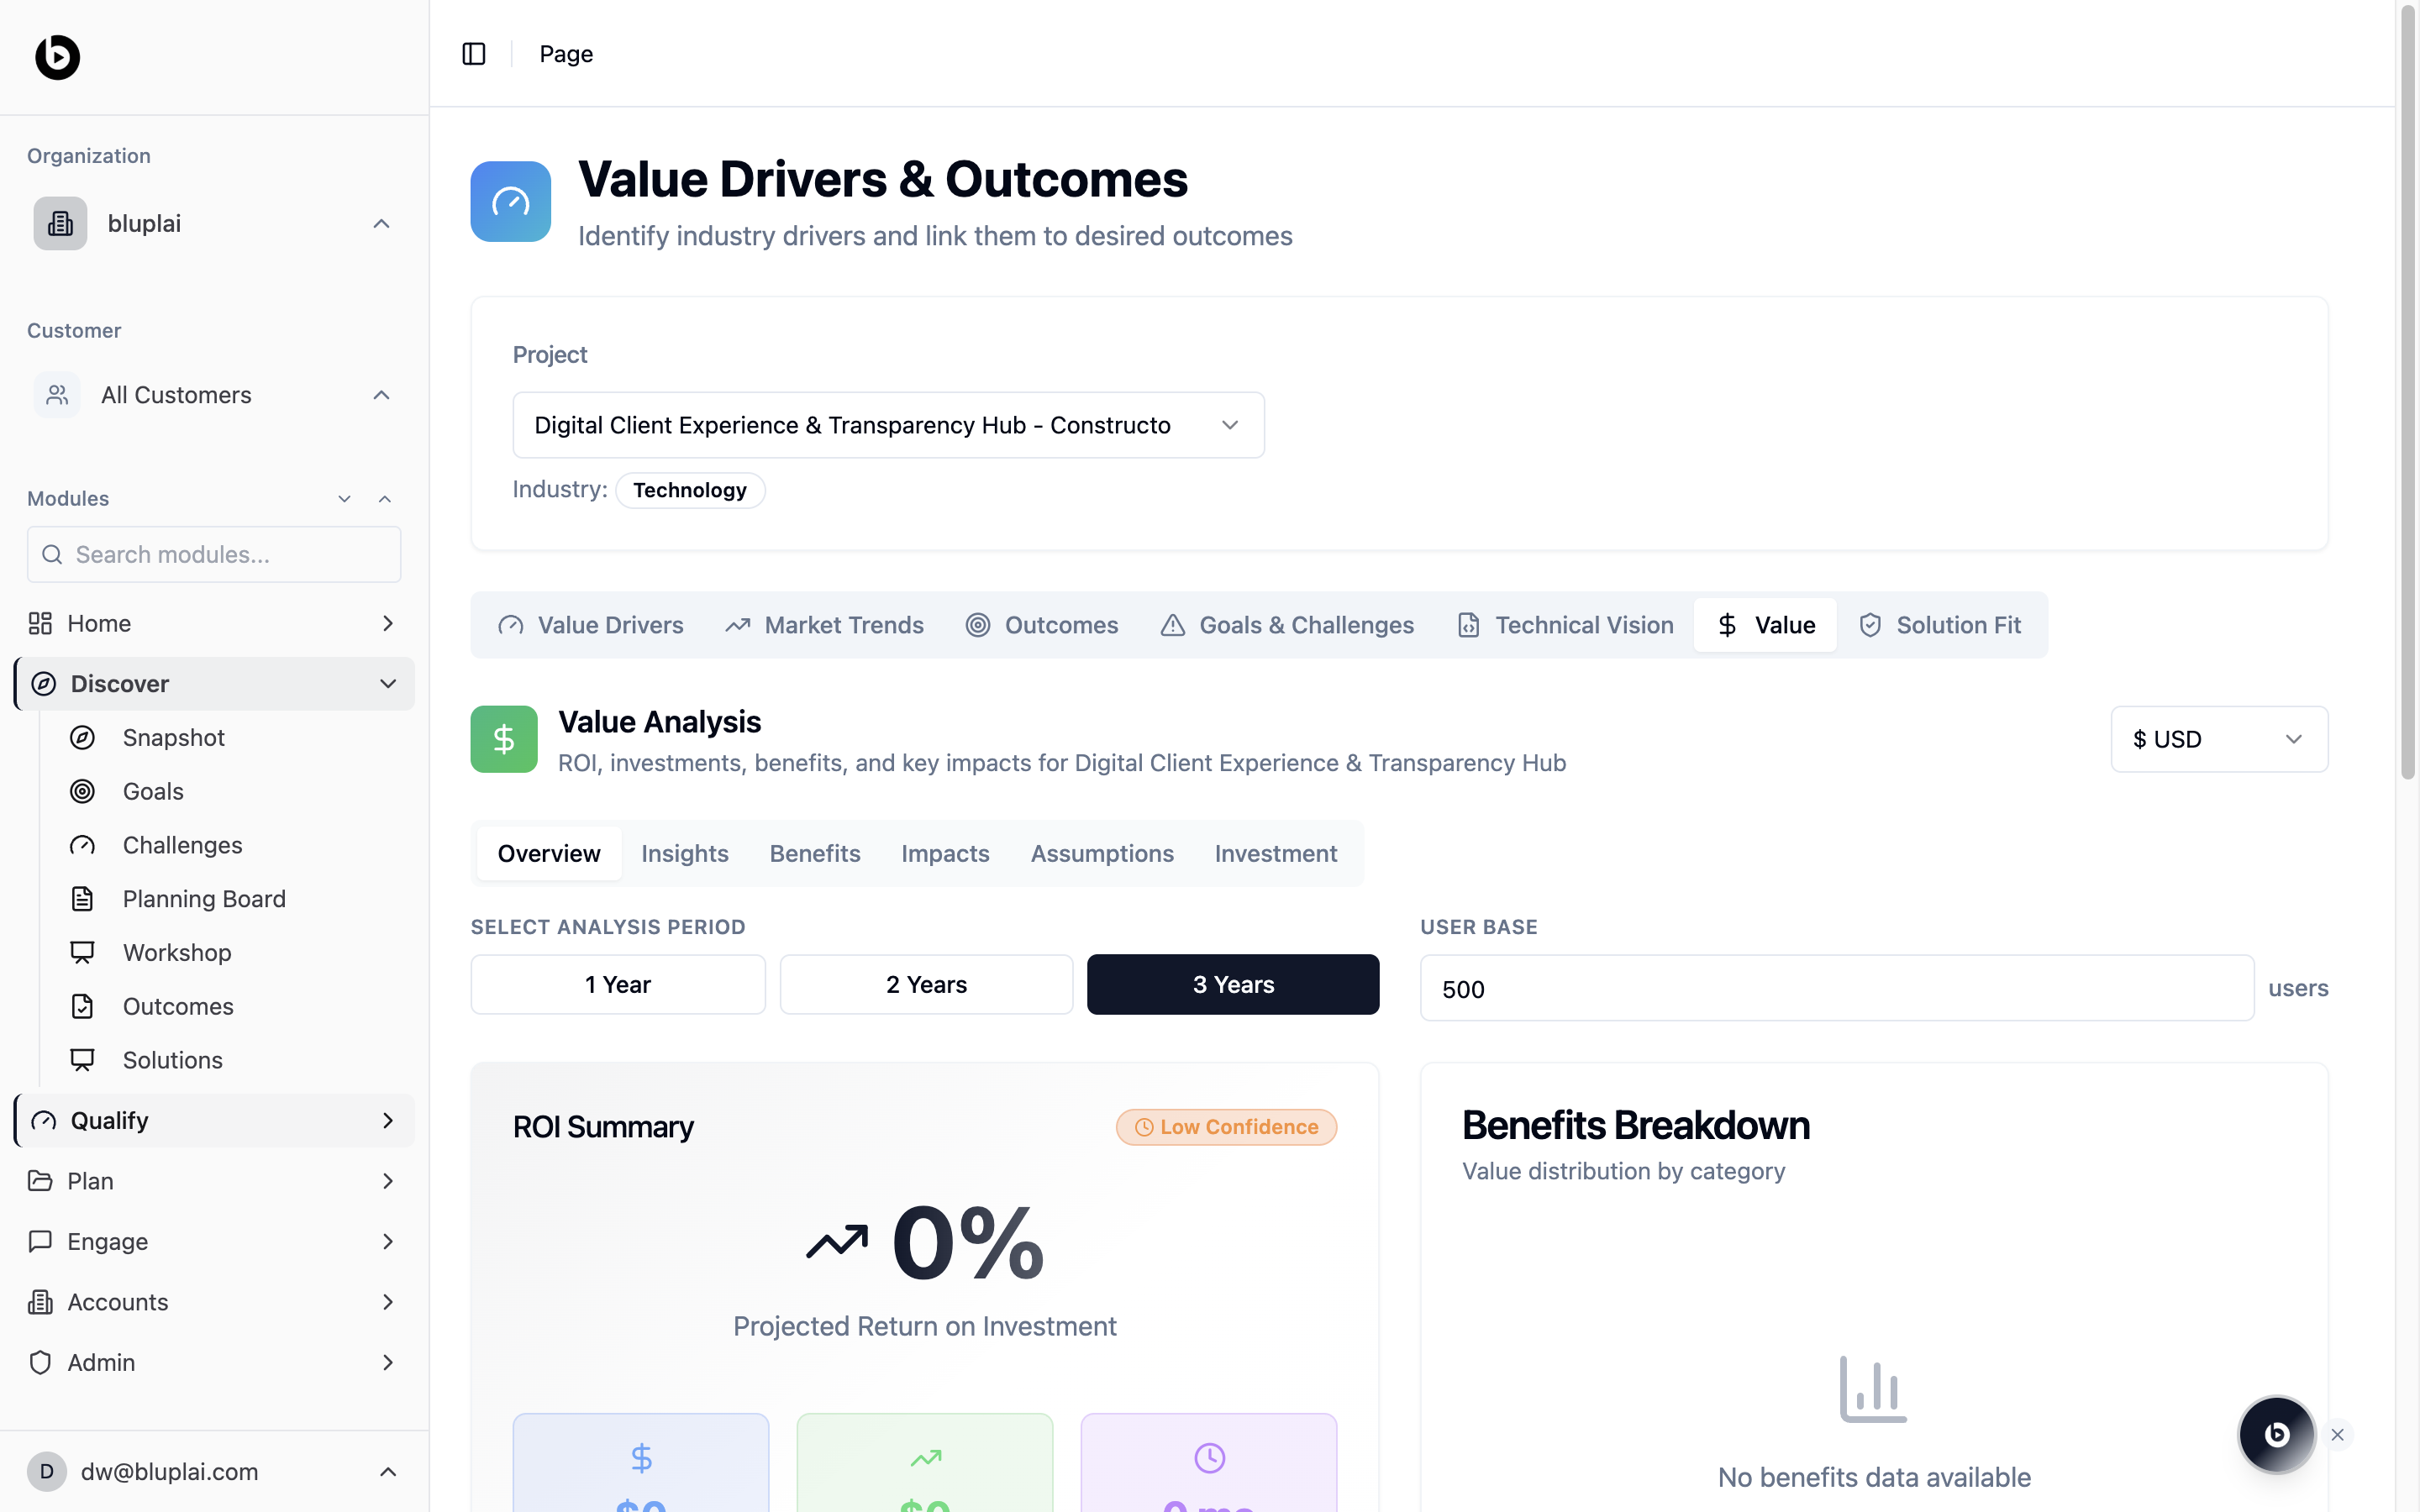
The **Value** tab opens on a **Value Analysis** panel described as "ROI, investments, benefits, and key impacts" for the current project, with a currency selector in the top right (for example, USD).
Inside it, a row of sub-tabs lets you move through the model without leaving the page:
* **Overview** — ROI summary and benefits breakdown (the default view)
* **Insights** — narrative takeaways on the model
* **Benefits** — the benefit line items
* **Impacts** — qualitative and strategic impacts
* **Assumptions** — the numbers behind the model
* **Investment** — the cost side of the case (see [Investments](/qualify/investments))
On the Overview sub-tab you'll also see:
* **Select analysis period** — 1 Year / 2 Years / 3 Years toggle (3 Years by default)
* **User base** — the population the model runs against (for example, 500 users)
* **ROI Summary** — headline return on investment, flagged as **Low Confidence** and showing **0%** projected return until you add benefits and investment data
* **Benefits Breakdown** — value distribution by category, empty until benefits are added ("No benefits data available")
## When to use it
* Building the first pass of a business case after outcomes are qualified
* Pressure-testing assumptions before an executive review
* Showing the customer exactly how the number was built — not just the number itself
* Tightening confidence as real data replaces placeholders
## Next
Capture the cost side of the model.
Review the qualified outcomes driving the value model.
## Why you're here
Value is where qualified drivers and outcomes turn into a business case. This tab replaces the usual spreadsheet-plus-slide workflow with a single model the whole team — and the customer — can read. Return on investment, benefits, impacts, and the assumptions behind them are all structured side by side.
## What you'll see
The **Value** tab opens on a **Value Analysis** panel described as "ROI, investments, benefits, and key impacts" for the current project, with a currency selector in the top right (for example, USD).
Inside it, a row of sub-tabs lets you move through the model without leaving the page:
* **Overview** — ROI summary and benefits breakdown (the default view)
* **Insights** — narrative takeaways on the model
* **Benefits** — the benefit line items
* **Impacts** — qualitative and strategic impacts
* **Assumptions** — the numbers behind the model
* **Investment** — the cost side of the case (see [Investments](/qualify/investments))
On the Overview sub-tab you'll also see:
* **Select analysis period** — 1 Year / 2 Years / 3 Years toggle (3 Years by default)
* **User base** — the population the model runs against (for example, 500 users)
* **ROI Summary** — headline return on investment, flagged as **Low Confidence** and showing **0%** projected return until you add benefits and investment data
* **Benefits Breakdown** — value distribution by category, empty until benefits are added ("No benefits data available")
## When to use it
* Building the first pass of a business case after outcomes are qualified
* Pressure-testing assumptions before an executive review
* Showing the customer exactly how the number was built — not just the number itself
* Tightening confidence as real data replaces placeholders
## Next
Capture the cost side of the model.
Review the qualified outcomes driving the value model.