> ## Documentation Index
> Fetch the complete documentation index at: https://docs.bluplai.com/llms.txt
> Use this file to discover all available pages before exploring further.
# Overview
> Top-level dashboard of every account engagement — counts, activity trends, module completion, and lifecycle stage breakdown.
 ## Why you're here
Home is the operational view of the relationship — not a sales dashboard. It's where you see overall relationship status, key activities across modules, recent interactions, and your own tasks before a customer call or team stand-up. A sales lead opens Home before a customer call and sees open commitments and recent activity without digging through notes, docs, or CRM. That alone saves 10–15 minutes per call and cuts the duplication between tools.
*You start the day knowing what's moved since yesterday — you don't search for it.*
## What you'll see
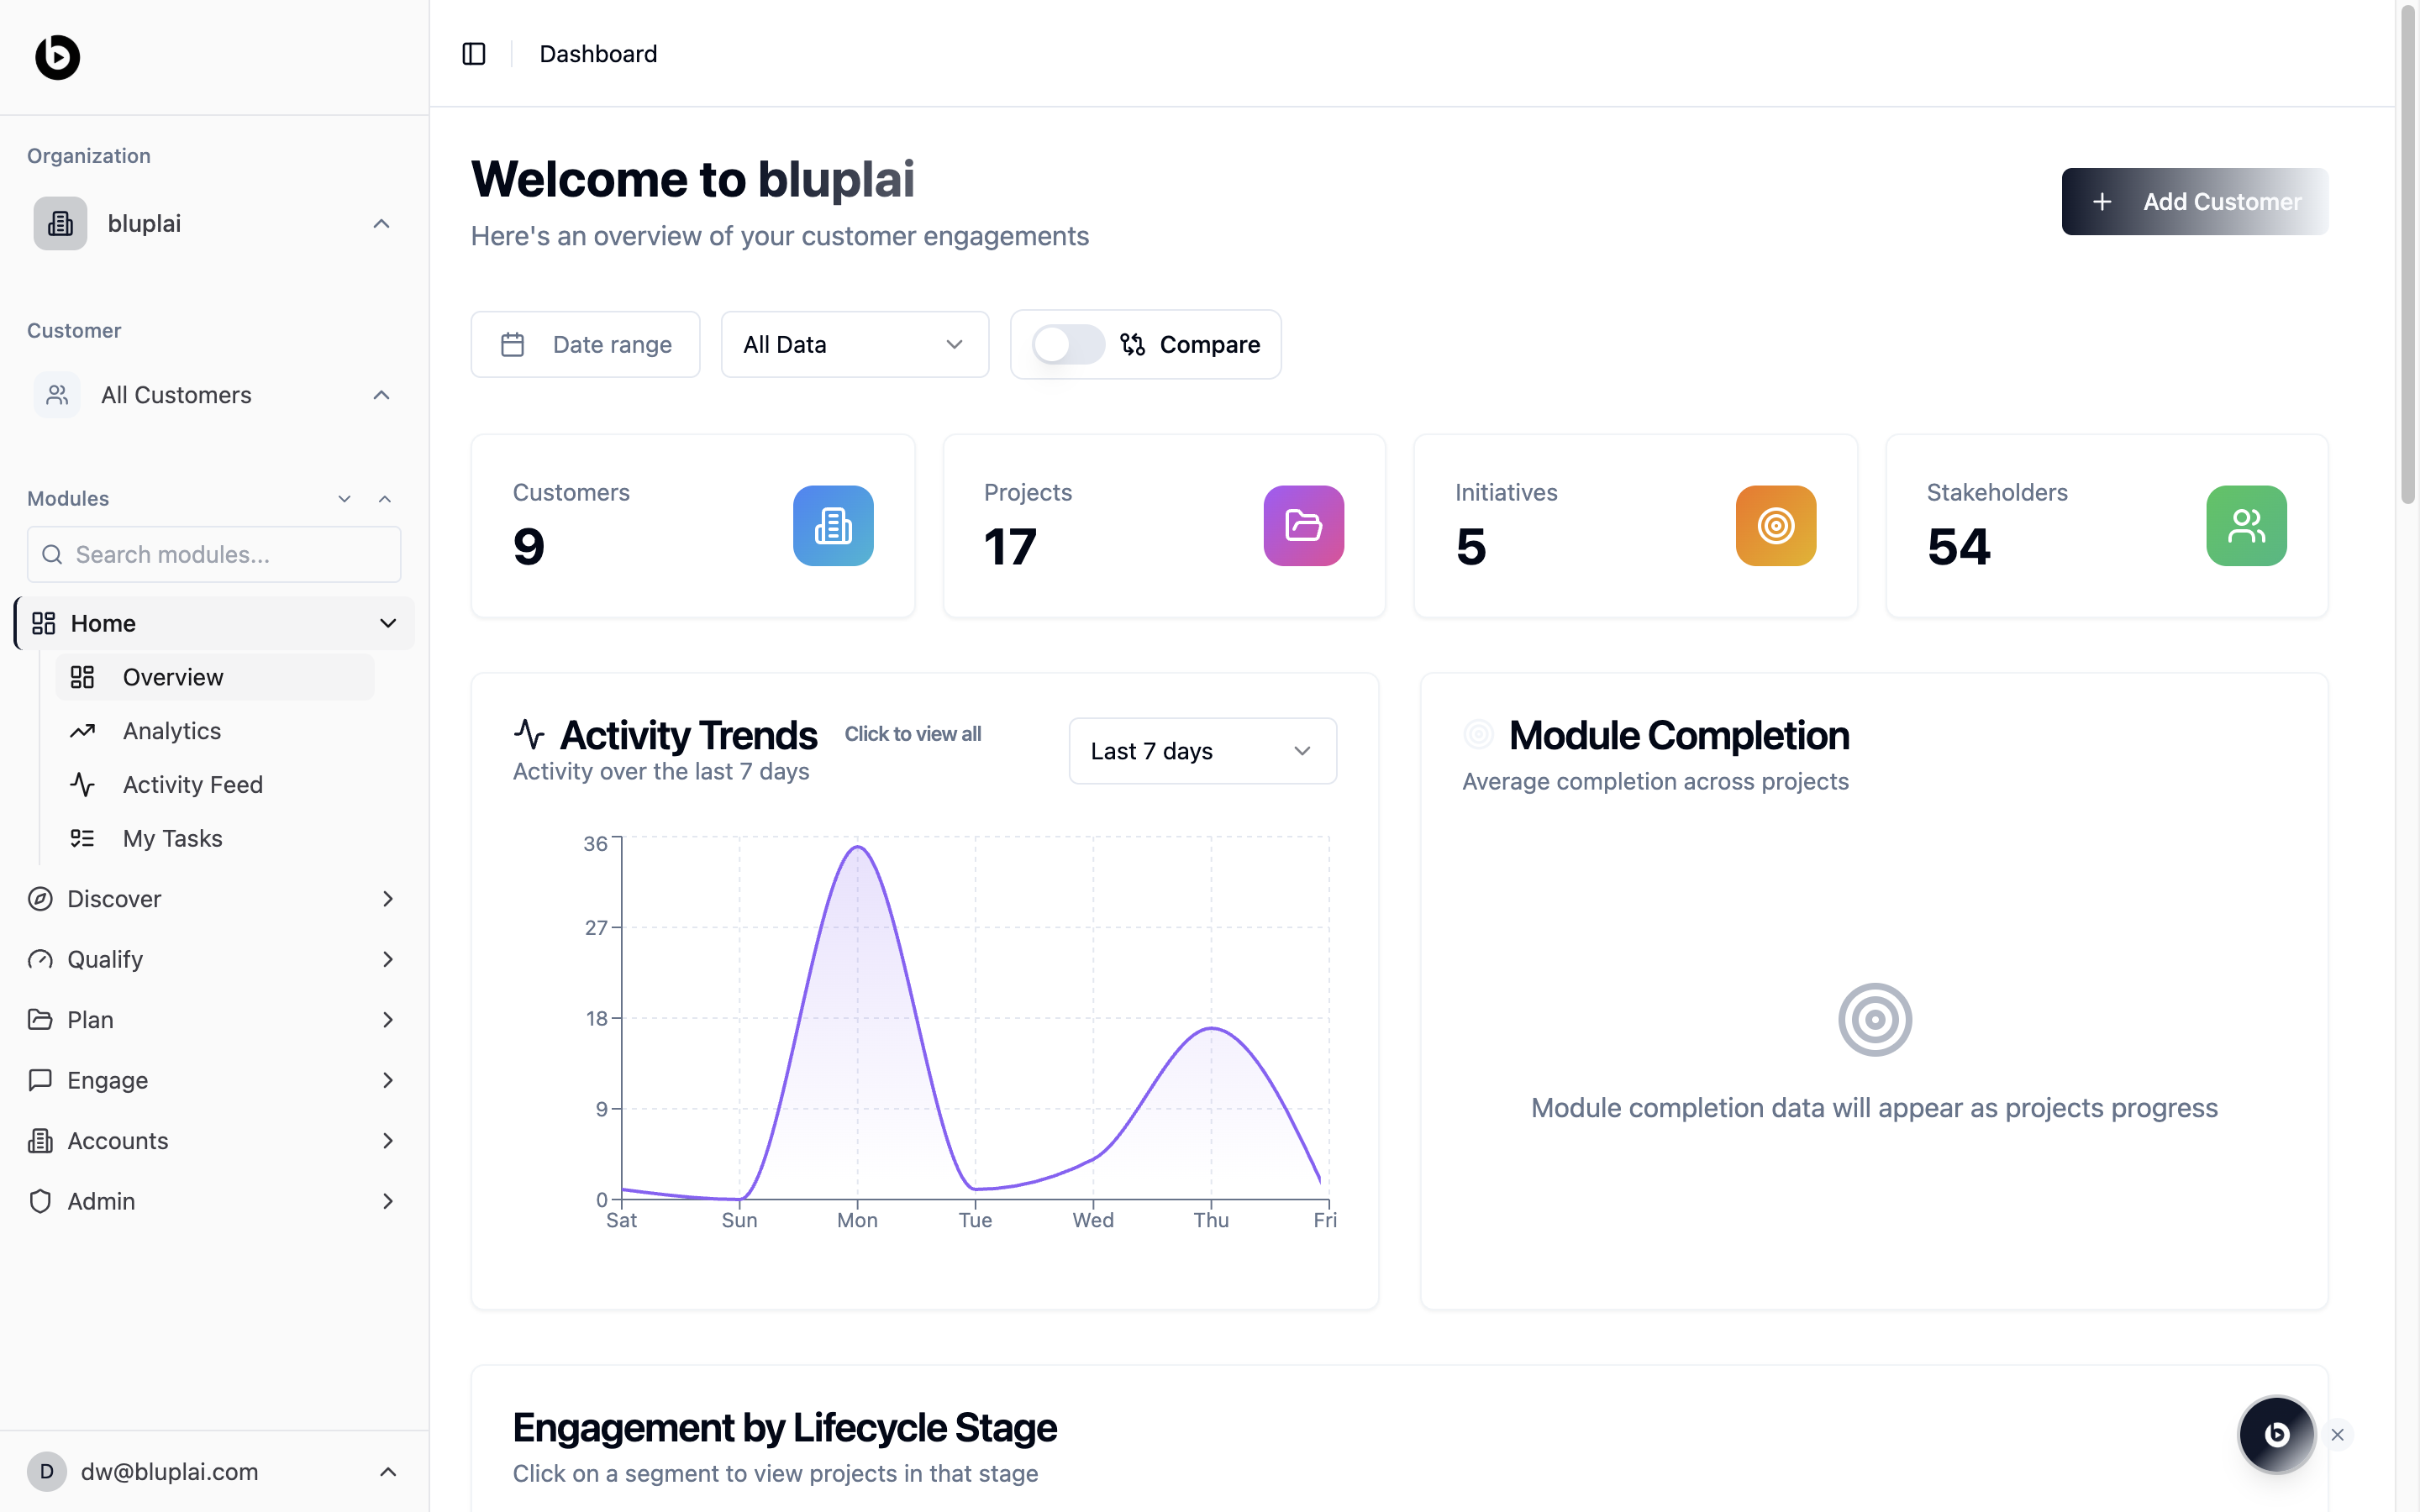
* A welcome header with a New account button in the top right.
* A Date range filter, an All Data selector, and a Compare toggle to benchmark two periods.
* Four portfolio counters: Accounts, Projects, Initiatives, and Stakeholders, each with a live count.
* An Activity Trends card plotting activity over a selectable window (default Last 7 days) — click the chart to open the full activity feed.
* A Module Completion card showing average completion across projects. If there's no project data yet, it stays in an empty state that reads "Module completion data will appear as projects progress."
* An Engagement by Lifecycle Stage section lower down, where each segment maps to Discover, Qualify, Plan, Engage, or Deliver — click a segment to drill into the projects sitting in that stage.
Use the account selector in the left sidebar to flip between All accounts and a single account. Every counter and chart on this page re-scopes to the selection.
## How it's calculated
Module Completion is a strict count of finished actions across projects — not a subjective health estimate.
```
Module Completion = completed or canceled actions / total actions
```
An action only counts once it's finished, completed, or canceled. Actions still in progress do not contribute. If something is closed, it counts; if it's still moving, it doesn't.
## When to use it
* Start the day with a read on whether activity is up or down versus last week.
* Spot the lifecycle stage that's getting congested (for example, too many projects stuck in Qualify).
* Pull totals for a weekly internal update without leaving the dashboard.
* Click into Activity Trends when a spike or flat line doesn't match your expectations.
## Next
Go deeper on portfolio health, risk, and top performers.
See the individual changes behind the trend chart.
## Why you're here
Home is the operational view of the relationship — not a sales dashboard. It's where you see overall relationship status, key activities across modules, recent interactions, and your own tasks before a customer call or team stand-up. A sales lead opens Home before a customer call and sees open commitments and recent activity without digging through notes, docs, or CRM. That alone saves 10–15 minutes per call and cuts the duplication between tools.
*You start the day knowing what's moved since yesterday — you don't search for it.*
## What you'll see
* A welcome header with a New account button in the top right.
* A Date range filter, an All Data selector, and a Compare toggle to benchmark two periods.
* Four portfolio counters: Accounts, Projects, Initiatives, and Stakeholders, each with a live count.
* An Activity Trends card plotting activity over a selectable window (default Last 7 days) — click the chart to open the full activity feed.
* A Module Completion card showing average completion across projects. If there's no project data yet, it stays in an empty state that reads "Module completion data will appear as projects progress."
* An Engagement by Lifecycle Stage section lower down, where each segment maps to Discover, Qualify, Plan, Engage, or Deliver — click a segment to drill into the projects sitting in that stage.
Use the account selector in the left sidebar to flip between All accounts and a single account. Every counter and chart on this page re-scopes to the selection.
## How it's calculated
Module Completion is a strict count of finished actions across projects — not a subjective health estimate.
```
Module Completion = completed or canceled actions / total actions
```
An action only counts once it's finished, completed, or canceled. Actions still in progress do not contribute. If something is closed, it counts; if it's still moving, it doesn't.
## When to use it
* Start the day with a read on whether activity is up or down versus last week.
* Spot the lifecycle stage that's getting congested (for example, too many projects stuck in Qualify).
* Pull totals for a weekly internal update without leaving the dashboard.
* Click into Activity Trends when a spike or flat line doesn't match your expectations.
## Next
Go deeper on portfolio health, risk, and top performers.
See the individual changes behind the trend chart.