> ## Documentation Index
> Fetch the complete documentation index at: https://docs.bluplai.com/llms.txt
> Use this file to discover all available pages before exploring further.
# Analytics
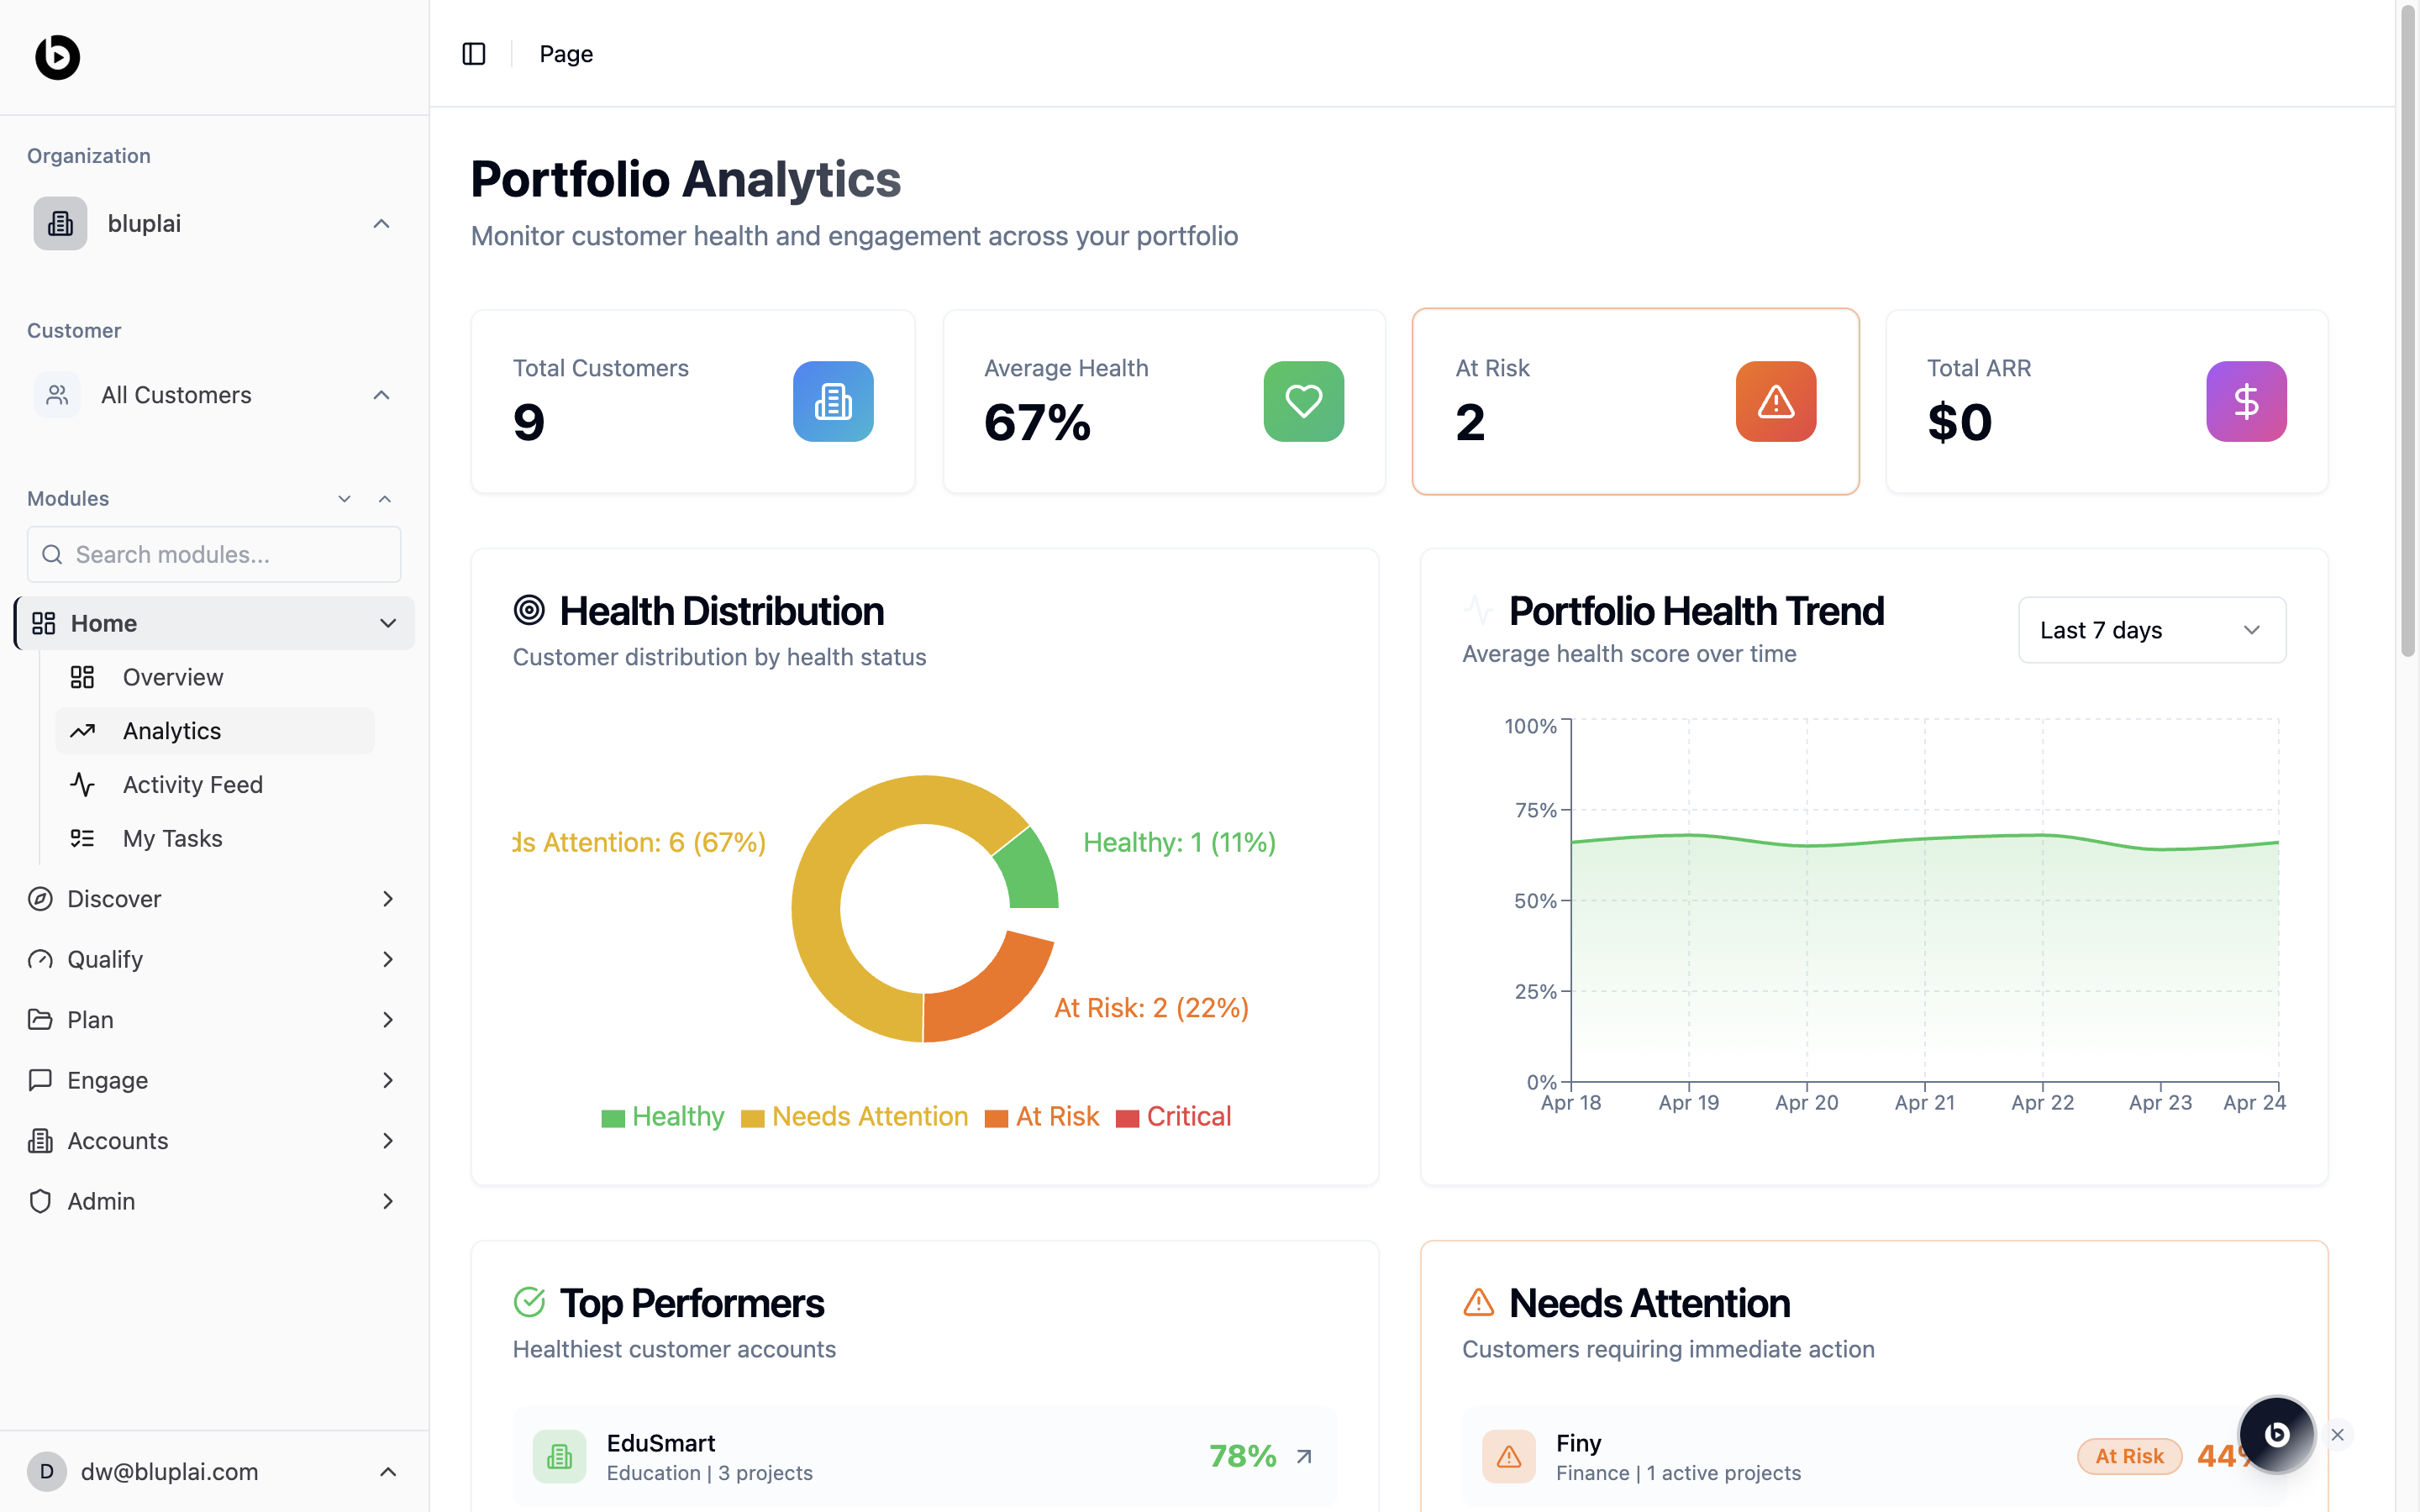
> Portfolio analytics view with health scores, risk distribution, trend chart, top performers, and accounts needing attention.
 ## Why you're here
Analytics is where you stop counting and start judging. It turns the portfolio into a health view — who's healthy, who's drifting, and who's already at risk. Open it when you need to prepare a pipeline review, pick the next save play, or answer the question "which three accounts matter most this week?"
## What you'll see
* Four summary tiles: Total accounts, Average Health (as a percentage), At Risk (count), and Total ARR.
* A Health Distribution donut breaking the portfolio into Healthy, Needs Attention, At Risk, and Critical, each with a count and share of total.
* A Portfolio Health Trend line charting the average health score over time, with a Last 7 days selector.
* A Top Performers panel listing the healthiest accounts with their industry, active project count, and health percentage.
* A Needs Attention panel listing accounts requiring immediate action, tagged At Risk with a health score.
Health scores are a composite signal — engagement activity, survey responses, initiative progress, and overdue work all feed the number. An account that drops into Needs Attention isn't automatically a churn risk, but it's the first place to look.
## How it's calculated
Today the Health Score shown in the UI is a rolling 12-month view of account health, bucketed into **Healthy**, **Needs Attention**, **At Risk**, and **Critical**.
The weighted formula below is defined but not yet live:
```
Health Score = token utilisation × adoption breadth × velocity
```
* **Token utilisation** — how actively the account's licensed seats are used.
* **Adoption breadth** — how many modules they touch.
* **Velocity** — rate of meaningful activity (actions closed, milestones moved).
Phase 1 (current): the 12-month view is what the page shows today. Phase 2: the weighted formula above rolls out later and will drive the same Healthy / Needs Attention / At Risk / Critical thresholds.
## When to use it
* Plan your save calls for the week by starting with the Needs Attention list.
* Benchmark a single account's health against the portfolio average.
* Spot a downward trend on the health line before it shows up in renewal conversations.
* Pull the Total ARR and At Risk numbers for an exec-level rollup.
## Next
Go back to the top-level portfolio dashboard.
See the recent changes driving these health scores.
## Why you're here
Analytics is where you stop counting and start judging. It turns the portfolio into a health view — who's healthy, who's drifting, and who's already at risk. Open it when you need to prepare a pipeline review, pick the next save play, or answer the question "which three accounts matter most this week?"
## What you'll see
* Four summary tiles: Total accounts, Average Health (as a percentage), At Risk (count), and Total ARR.
* A Health Distribution donut breaking the portfolio into Healthy, Needs Attention, At Risk, and Critical, each with a count and share of total.
* A Portfolio Health Trend line charting the average health score over time, with a Last 7 days selector.
* A Top Performers panel listing the healthiest accounts with their industry, active project count, and health percentage.
* A Needs Attention panel listing accounts requiring immediate action, tagged At Risk with a health score.
Health scores are a composite signal — engagement activity, survey responses, initiative progress, and overdue work all feed the number. An account that drops into Needs Attention isn't automatically a churn risk, but it's the first place to look.
## How it's calculated
Today the Health Score shown in the UI is a rolling 12-month view of account health, bucketed into **Healthy**, **Needs Attention**, **At Risk**, and **Critical**.
The weighted formula below is defined but not yet live:
```
Health Score = token utilisation × adoption breadth × velocity
```
* **Token utilisation** — how actively the account's licensed seats are used.
* **Adoption breadth** — how many modules they touch.
* **Velocity** — rate of meaningful activity (actions closed, milestones moved).
Phase 1 (current): the 12-month view is what the page shows today. Phase 2: the weighted formula above rolls out later and will drive the same Healthy / Needs Attention / At Risk / Critical thresholds.
## When to use it
* Plan your save calls for the week by starting with the Needs Attention list.
* Benchmark a single account's health against the portfolio average.
* Spot a downward trend on the health line before it shows up in renewal conversations.
* Pull the Total ARR and At Risk numbers for an exec-level rollup.
## Next
Go back to the top-level portfolio dashboard.
See the recent changes driving these health scores.